Market Recap for Thursday, March 10, 2016
We've had little economic news out this week so equity markets have been left to trade off technical indications. After the European Central Bank's (ECB) announcement of further quantitative measures triggered a very quick surge to the upside in global equities, reality set in and we saw impulsive selling here in the U.S. that took prices down to test critical moving averages - quite successfully I might add. Earlier, the bears' mettle was tested as prices hit or neared price resistance. That's where the market stands right now, gravitating back and forth between rising moving average support and price resistance. One look at the NASDAQ daily chart pretty much sums it up:
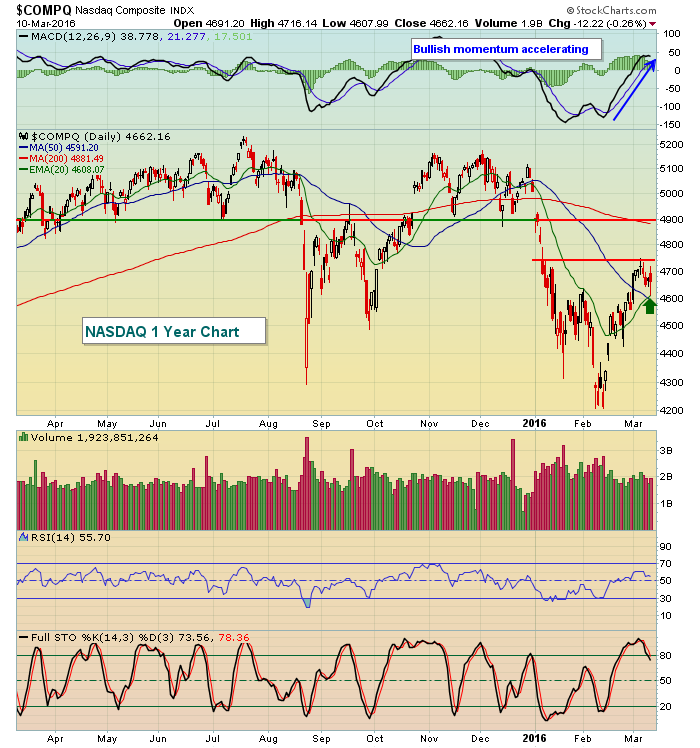 Couple things to note here. First, the volume was less than 2 billion shares despite the enormity of the ECB announcement. Second, all of the trading occurred between 20 day EMA support (green) and price resistance (lower horizontal red line). It was a long candle, which was indicative of the volatility and market indecision. But at the end of the day, support and resistance both held. That sets the market up for a continuing technical battle.
Materials (XLB) showed relative strength, gaining .53% and leading all other sectors. The remaining eight sectors finished the volatile session plus or minus .25% as this also painted a picture of indifference to the morning announcement.
Pre-Market Action
We're looking at the potential of a repeat of Thursday's pre-market action. U.S. futures are solidly higher, once again following the lead of global indices. After early weakness, Asian markets turned higher and European markets are soaring - just like Thursday. It's the stock market's version of the movie "Groundhog Day".
Globally, banks are getting a lift this morning and the Dow Jones U.S. Banks Index ($DJUSBK) has a very interesting pattern developing on its daily chart. Have a look:
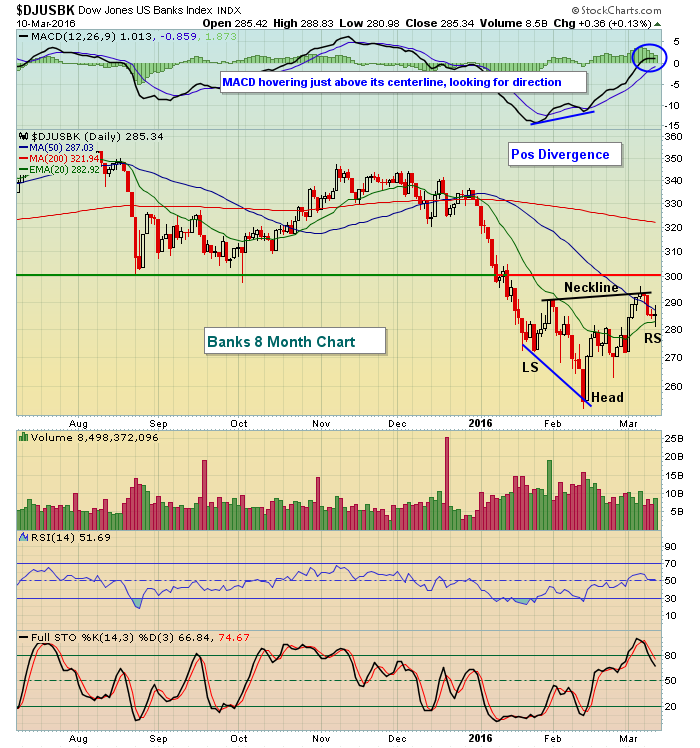 The reverse head & shoulders pattern is a potential bottoming formation. It requires a breakout above neckline resistance on heavy volume to confirm. There's a possible trap here, though, as major price resistance resides near 300. In prior blog articles, I've provided a look at the DJUSBK weekly chart which showed a series of price support lows in the 290-300 range. That has become a very important area of price resistance that must be negotiated. Therefore, if the DJUSBK breaks above neckline resistance but fails to clear 300, I'd remain cautious as the failure of banks to regain their bullish technical form would send a very confusing signal to market participants. In addition to banks, asset managers ($DJUSAG) are in similar position of interest. This group is featured below in the Sector/Industry Watch section.
Current Outlook
Earlier in this article, I provided a one year chart of the NASDAQ, showing the clear kick save on Thursday at the rising 20 day EMA. That was most definitely a bullish development - at least in the near-term. The NASDAQ has a bigger long-term problem, though. The weekly chart is much more bearish with a horrid weekly MACD and failure thus far at the declining 20 week EMA. Check this out:
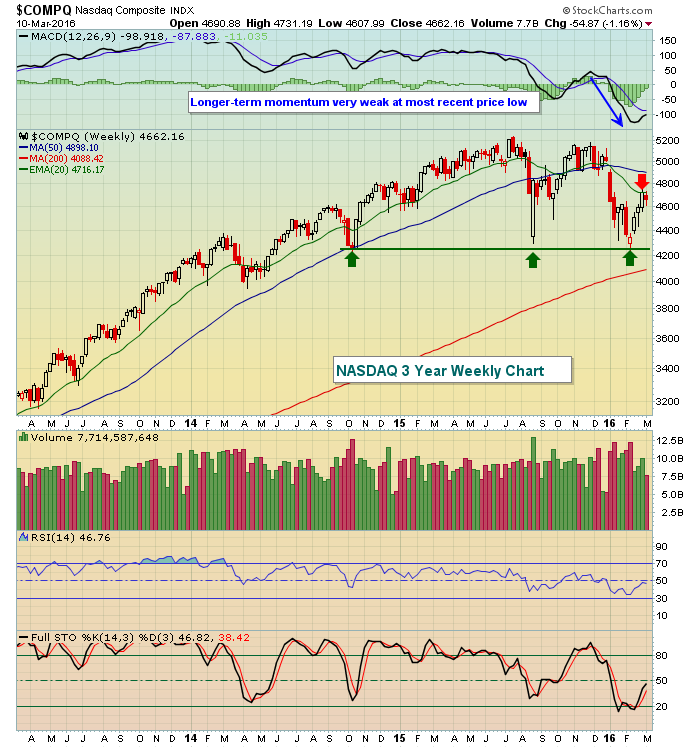 On the daily chart, we're looking at overhead price resistance and a rising 20 period EMA as support. On the weekly chart, it's the oppposite. We have price support that's been holding and a declining 20 period EMA holding as resistance. Technically, a breakout above 20 week EMA resistance would potentially offer up bullish longer-term implications.
Sector/Industry Watch
The financial sector (XLF) is one of the aggressive sectors where I look for leadership during stock market rallies. Within the XLF, there are defensive areas like the REITs. Other industry groups are considered more aggressive and generally perform better during periods of economic improvement and rising interest rates. Those include banks (chart featured above) and asset managers. Below is a quick look at the latter:
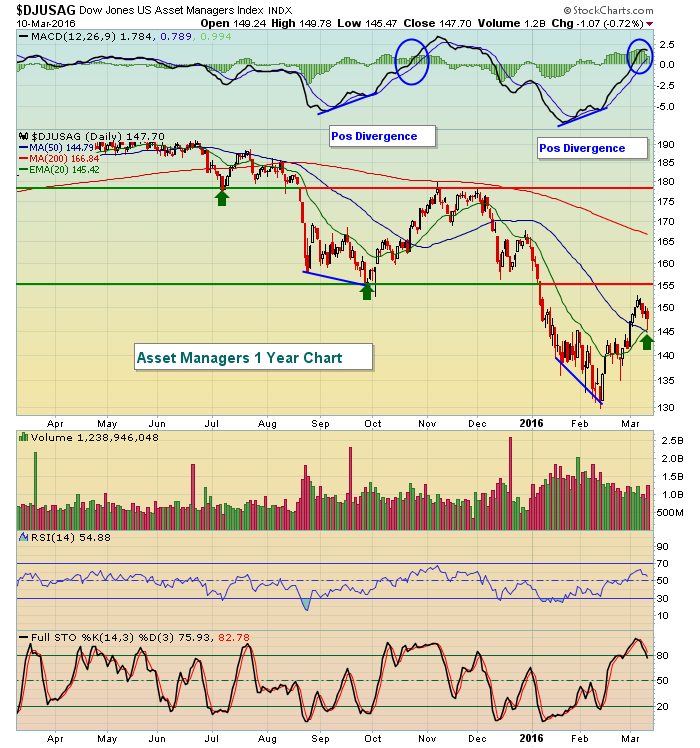 There are a couple lessons here. Note that we saw extended rallies after both positive divergences printed. But note that the first rally failed after a very strong momentum push on the MACD above centerline resistance. In other words, bullish momentum was accelerating. Failure occurred at price resistance, however, and that's why I always say that my #1 technical indicator is the combination of price and volume. It doesn't matter what the MACD looks like, price resistance must be cleared. Now let's fast forward to the current rally. It also is coming off a positive divergence. We've seen great technical action of late, clearing overhead moving average resistance and yesterday's successful test of the rising 20 day EMA (green arrow) is solid action for sure. But like the double top and failure in November and December, don't lose sight of current price resistance. That level is near 155 and will serve as a major test for this space.
Historical Tendencies
When it comes to the benchmark S&P 500, the bulls can truly say "TGIF!" The S&P 500 has moved higher 53.5% of all days since 1950. But Fridays produce gains 56.7% of the time historically. Also, the annualized return on Fridays (+17.7%) is nearly double that of the S&P 500. Those who say you can't time the stock market have never studied history as your odds can certainly improve if you understand the effect that the calendar plays in trading.
Key Earnings Reports
None
Key Economic Reports
None
Happy trading!
Tom


