Market Recap for Tuesday, March 22, 2016
The Dow Jones, S&P 500 and Russell 2000 all turned lower on Tuesday, but the NASDAQ managed to take over relative leadership and finish with fractional gains. Healthcare (XLV) has been the lagging sector over the past month, but led all sectors on Tuesday with a 1.0% rise. The sector was boosted by a revived biotechnology ($DJUSBT) space that posted a 2.11% gain. On a short-term basis, the DJUSBT is approaching key price resistance as reflected below:
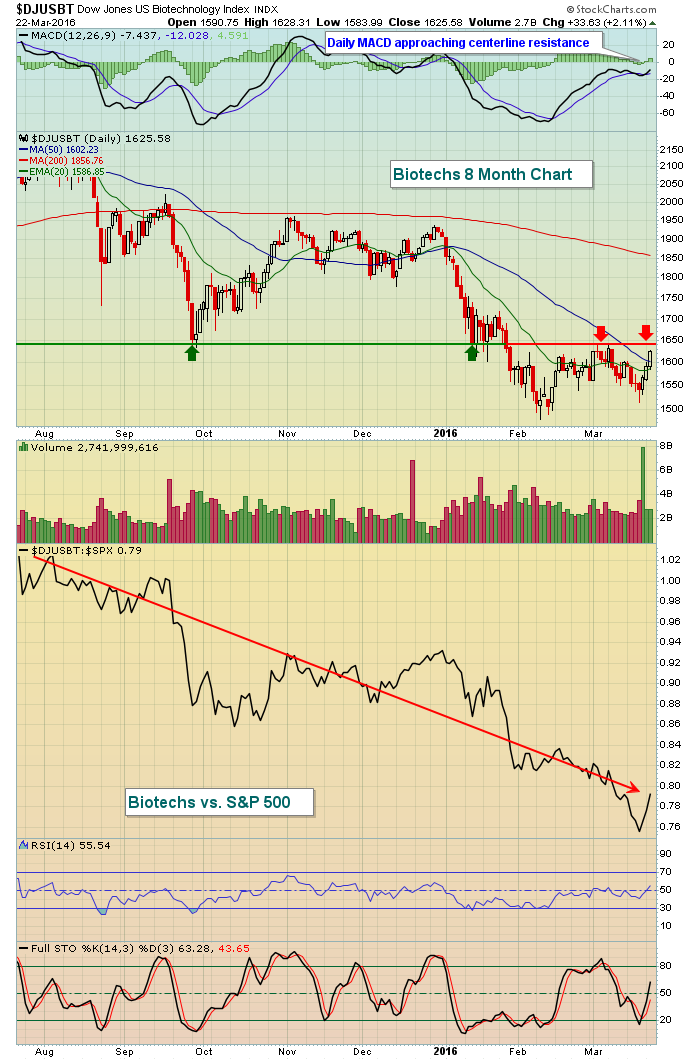 The price action on Tuesday was solid, but the red arrows mark price resistance near 1640 that the bulls will face in the very near-term. But there are two other problems that biotechs will face in the days and weeks ahead. First, the relative strength of biotechs (vs. the S&P 500) has been horrid. They have consistently underperformed that benchmark index over the past several months. Perhaps more importantly the DJUSBT will have further obstacles overhead even if they make the breakout shown above. Check out the longer-term weekly chart:
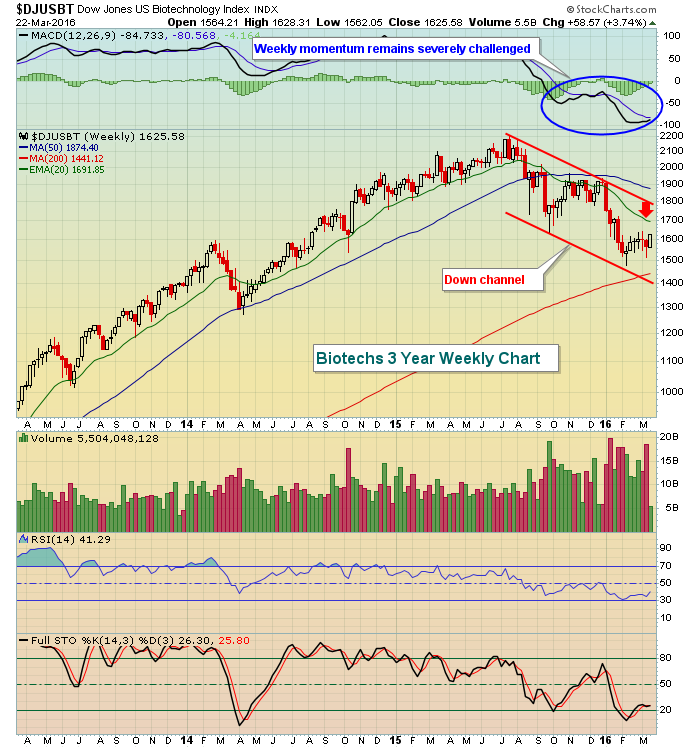 The down channel and the declining 20 week EMA will likely prove to be difficult overhead areas to clear.
Pre-Market Action
Asian markets were mixed overnight, but action in Europe is mostly positive this morning with the German DAX currently trading above the 10000 level. China's Shanghai Composite ($SSEC) recently penetrated its psychological 3000 resistance and now we see the DAX attempting to clear a psychological hurdle as well. Technical conditions on the DAX remain quite strong in the near-term with the rising 20 day EMA continuing to serve as solid support on bouts of selling.
There's little economic or earnings data to trade off of. Nike (NKE) did report its results on Tuesday after the close and disappointing revenues have led to a 5% haircut this morning in pre-market trading. General Mills (GIS) reported similar results - an earnings beat, but a top line miss - and its shares are flat this morning thus far after trading down earlier. Krispy Kreme (KKD) reported anything but sweet news. KKD lowered guidance and its stock seems to be missing an ingredient or two this morning with pre-market losses of 8.3% adding to prior technical troubles.
Treasury bulls and bears continue their fierce battle as the 10 year treasury yield ($TNX) hovers in a fairly significant 1.90%-2.00% trading range. A break to the downside would be bearish for equity prices, while a breakout above 2.00% would provide the proceeds necessary to help fuel another leg higher in the S&P 500.
At last check, U.S. futures are pointing to a slightly lower open. 60 minute negative divergences could be one of the culprits as I've pointed out below in the Current Outlook section.
Current Outlook
We now have 60 minute negative divergences on all of our major indices, except the Russell 2000 ($RUT). While this means little in terms of future long-term performance, it can serve as a short-term wall for the bulls. Below is the past couple months hourly chart on the S&P 500:
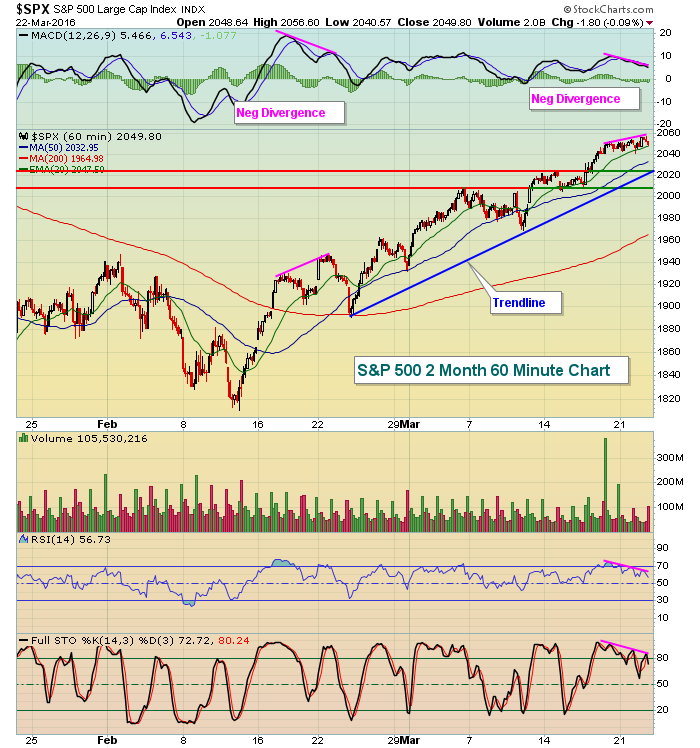 You can see that a negative divergence printed this same time last month and a subsequent drop of roughly 2.5% ensued. But the uptrend off the February 11th low remains in force. From a short-term bullish perspective, a selloff down to the rising 50 hour SMA of 2033 would keep the uptrend intact and reset the hourly MACD to zero, or close to it. Failure to hold both support levels shown would suggest we turn to the intermediate-term daily chart for next support. That would be the rising 20 day EMA, which currently resides at 2001.
On the latest negative divergence, note that I also have shown how both the RSI and stochastic are dropping while prices rise. Those are negative divergences as well, but I don't typically use those to determine positive and negative divergences as they're bound oscillators. By "bound", I mean they cannot move above 100. Especially with stochastic, it's not unusual to see this oscillator hit or approach 100. The problem with using divergences on stochastic is that once this oscillator hits 100, it's a mathematical certainty you'll see an equal or lower reading on the next price high because the stochastic reading cannot go above 100. So I find comparing highs and lows on stochastic to be relatively useless - just my opinion. I do occasionally use the divergences on the RSI to confirm what I'm seeing on the MACD, but I rarely would use the RSI solely.
Sector/Industry Watch
Energy (XLE) continues to look quite strong technically, aided by the steady ascent of crude oil prices ($WTIC). The XLE has solid potential to rise to the low 70s to possibly print a neckline, connecting the high from early November 2015. Have a look:
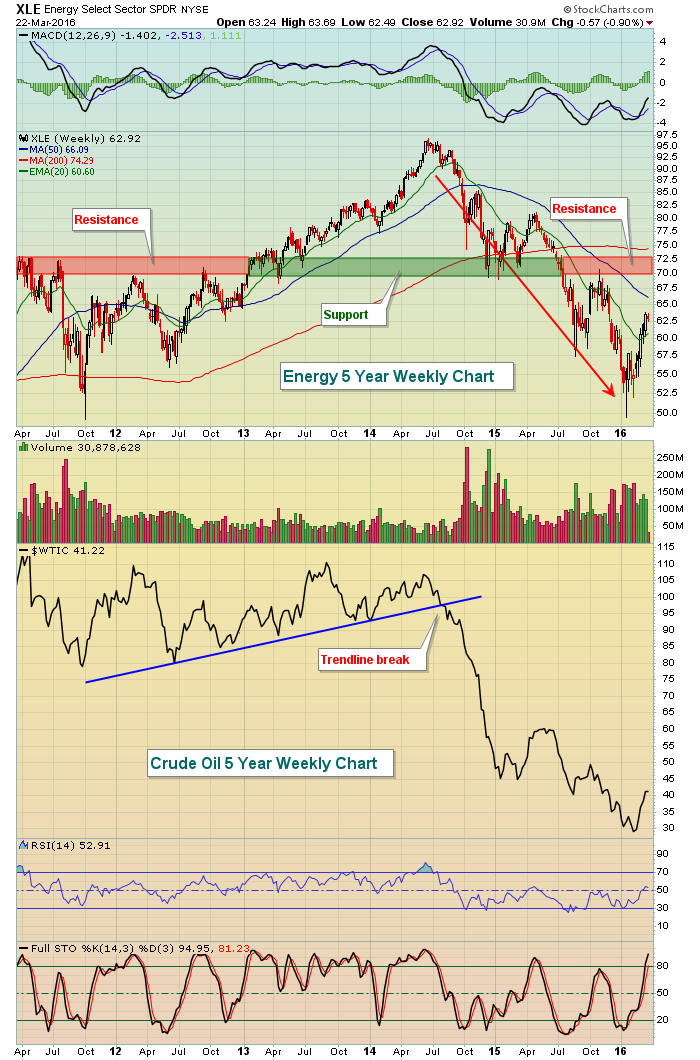 There was a positive divergence at the recent low on the XLE and we've subsequently seen the sector push right through the declining 20 week EMA. The next key level will be the falling 50 week SMA, currently at 66.09. A break above the 50 week SMA would enable the XLE to likely move into the red shaded resistance zone to establish the right side of a neckline in what could later prove to be a bottoming reverse H&S pattern.
Historical Tendencies
April ranks as the 4th best performing calendar month in terms of annualized returns on the NASDAQ since 1971. Its annualized return of 17.01% trails only January (+28.21%), December (+22.40%) and November (+18.98%). The NASDAQ has risen 29 times out of 45 years during the month of April.
In the current decade, April has posted an annualized return of +10.38% and has risen 4 out of the past 6 years.
Key Earnings Reports
(actual vs. estimate):
GIS: .65 vs .61
(reports after close, estimate provided):
KBH: .11
PVH: 1.45
Key Economic Reports
February new home sales to be released at 10:00am EST: 510,000 (estimate)
Happy trading!
Tom


