Market Recap for Wednesday, March 23, 2016
Energy (XLE) was under heavy selling pressure on Wednesday for the first time in two weeks and that sector was primarily responsible for the weakness in the S&P 500. Seven of nine sectors finished lower, however, as only the defensive utilities (XLU) and consumer staples (XLP) sectors were able to escape the sellers. With the 10 year treasury yield ($TNX) tumbling six basis points back to 1.88%, its recent uptrend is now in question and the prospects of lower treasury yields sent traders scurrying for the high dividend utilities space. The following chart shows that utilities remain in favor:
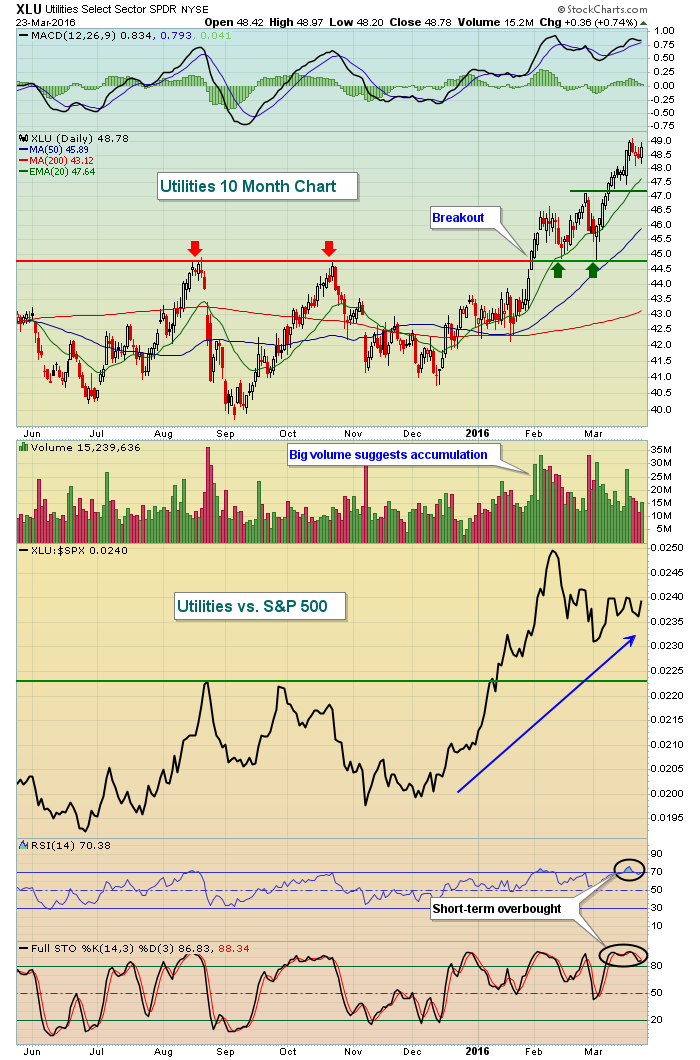 Despite the selling on Wednesday in most sectors, utilities managed to post a 0.74% gain to lead. Utilities are not only leading on an absolute basis, but also on a relative basis as you can see from the XLU:$SPX relative ratio above.
Energy's weakness was prompted mostly by coal ($DJUSCL), which fell more than 13% yesterday. The key will be whether its multi-month pivot level is lost on this weakness. Check out the Sector/Industry Watch section below for a look into the DJUSCL chart.
Pre-Market Action
U.S. futures are very weak and at their lowest levels of the morning at last check. It appears those 60 minute negative divergences that printed recently have given the bears the upper hand and they're taking advantage of it. Here's a reprint of a chart I showed yesterday. It's a look at the slowing momentum that was evident on the S&P 500's 60 minute chart:
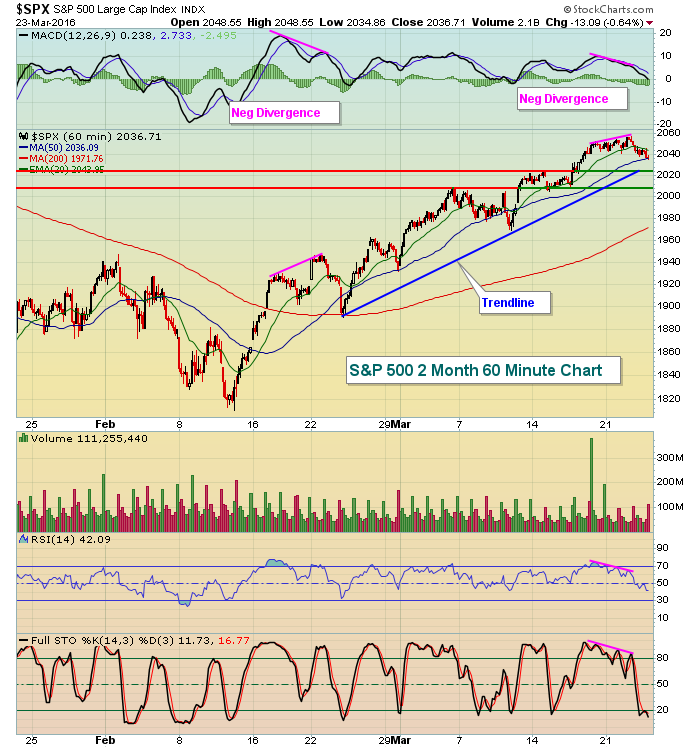 Given this morning's weak futures, the short-term price support levels are likely to be tested. Failure to hold support could result in an accelerated decline. Be careful on the long side if support fails as we still have many bearish longer-term signals - especially in terms of sector and industry group rotation.
Current Outlook
One key ingredient to accelerated selling and a bearish market environment is an increase in fear, or the Volatility Index ($VIX). When the VIX remains below 20, we typically see bull markets. When the VIX surges above 20, equity prices normally fall. The increased VIX level is important because when market participants are nervous, bad news is not handled well and even good news is routinely ignored. When the VIX is downtrending and below 20, especially below 15, the opposite is true. We typically see bad news ignored as the market moves higher - usually in rather boring fashion.
Here's a weekly chart to illustrate:
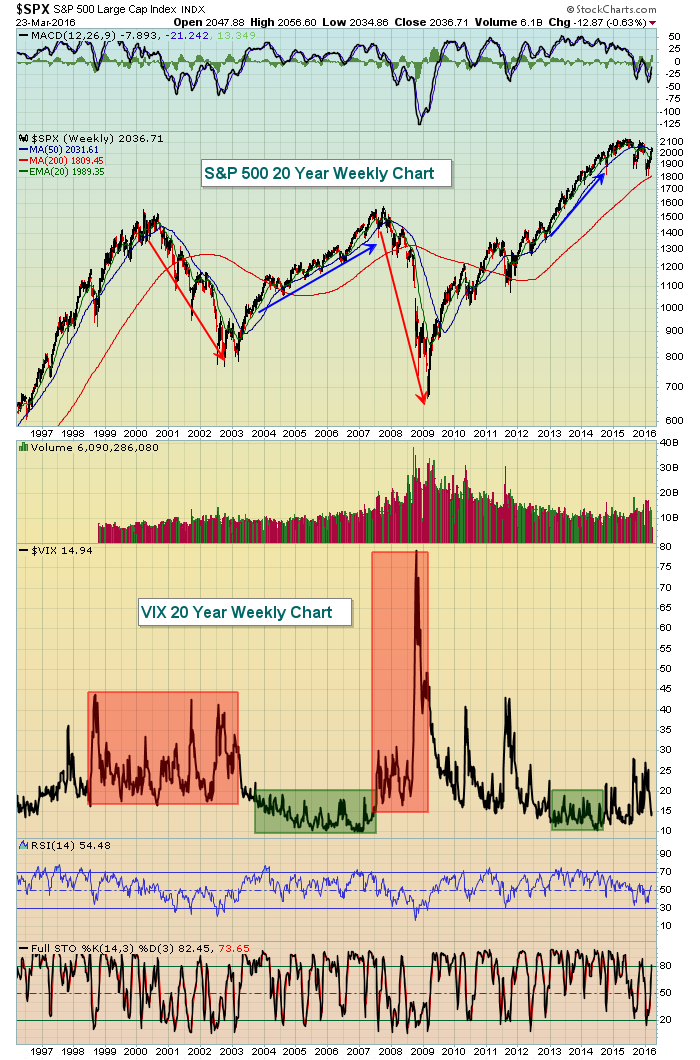 The red shaded areas reflect the movement in the VIX during bear markets while the green shaded areas represent periods when the VIX remains below 20 for extended periods (years). In those cases, the S&P 500 rarely sees heavy selling. In fact, the uptrends are nearly parabolic when fear drops to low levels and stays there.
We saw the VIX on the rise yesterday, climbing more than 5%. Take a look at the short-term picture on the VIX:
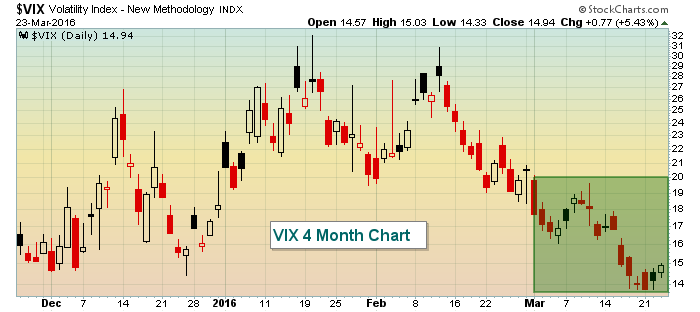 Note that the solid advance in the S&P 500 this month has taken place with the VIX below 20 and descending throughout the month. The bulls will be watching the VIX to make sure it remains below 20. A move above would begin to look like a more bearish market environment, especially if the S&P 500 were to move back beneath the 1990-2000 area of price support.
Sector/Industry Watch
Coal tumbled on Wednesday and this has been a very volatile group. Check out the wild swings back and forth and the key pivot level to watch in the days and weeks ahead:
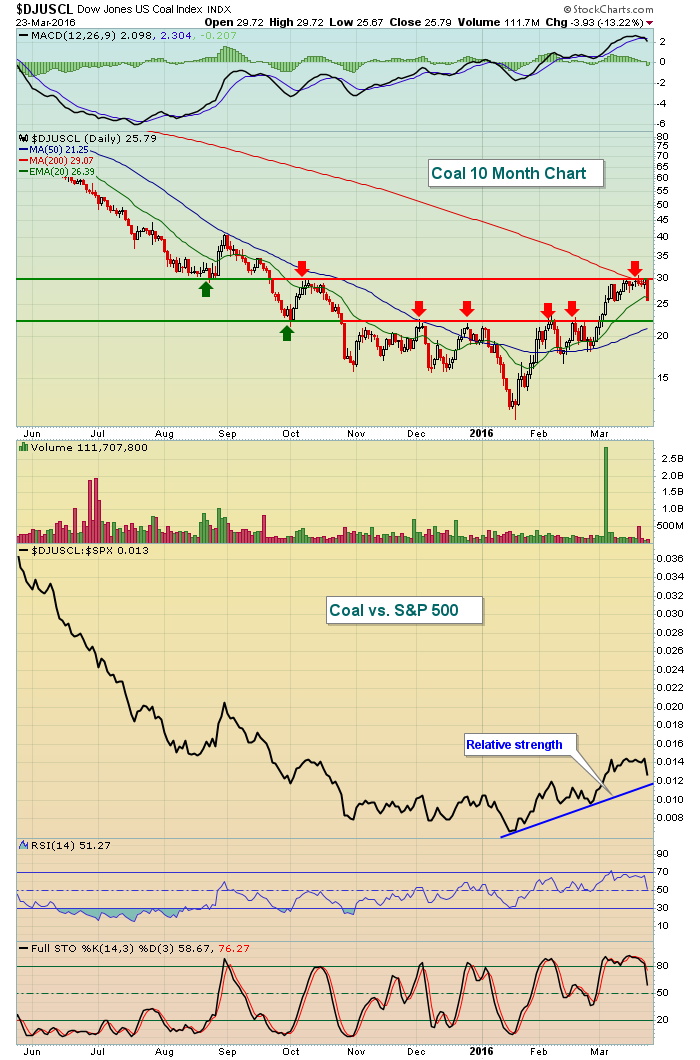 The relative strength trendline remains strong and key price support near 22.50 is holding for now. Coal does move quickly in both directions, though, so another 13% drop to test this price support level may not be far off. The wide trading range could provide nice reward to risk setups for those willing to take positions in this volatile and risky area of the stock market.
Historical Tendencies
March shows a great deal of volatility by calendar day of the month on the NASDAQ. For instance, the 24th of March shows annualized returns of -64.44%. But the next two days (March 25th and 26th) show annualized returns of +22.44% and 62.61%, respectively.
Key Earnings Reports
(actual vs. estimate):
ACN: 1.34 vs 1.18
(reports after close, estimate provided):
GME: 2.25
Key Economic Reports
February durable goods released at 8:30am EST: -2.8% (actual) vs. -3.0% (estimate)
February durable goods ex-transports released at 8:30am EST: -1.0% (actual) vs. -0.2% (estimate)
Initial jobless claims released at 8:30am EST: 265,000 (actual) vs. 268,000 (estimate)
Happy trading!
Tom


