Reminders
First, please subscribe to my blog at the bottom of this article. Simply click on "Yes" to the question, enter your email address and click "Subscribe". By doing so, my article will be sent directly your email as soon as it's published. It's the quickest way to receive my blog articles. Second, I conduct webinars every Monday, Wednesday and Friday at noon eastern. Today's webinar will focus on the debate between bull vs. bear market, which you'll likely find interesting. These webinars are designed to be highly educational, but with my own personal twist. You can register for today's webinar by CLICKING HERE.
Market Recap for Tuesday, March 29, 2016
Bulls, want some good news? The technology sector (XLK) closed at an all-time high on Tuesday with a finish at 44.19. The previous high close was 44.12 on December 4, 2015. The XLK gained 1.56% to lead all sectors yesterday and was led higher by mobile telecommunications ($DJUSWC), computer hardware ($DJUSCR) and internet ($DJUSNS). Below is a longer-term weekly chart of the DJUSCR, the industry group that includes the world's most popular stock - Apple (AAPL):
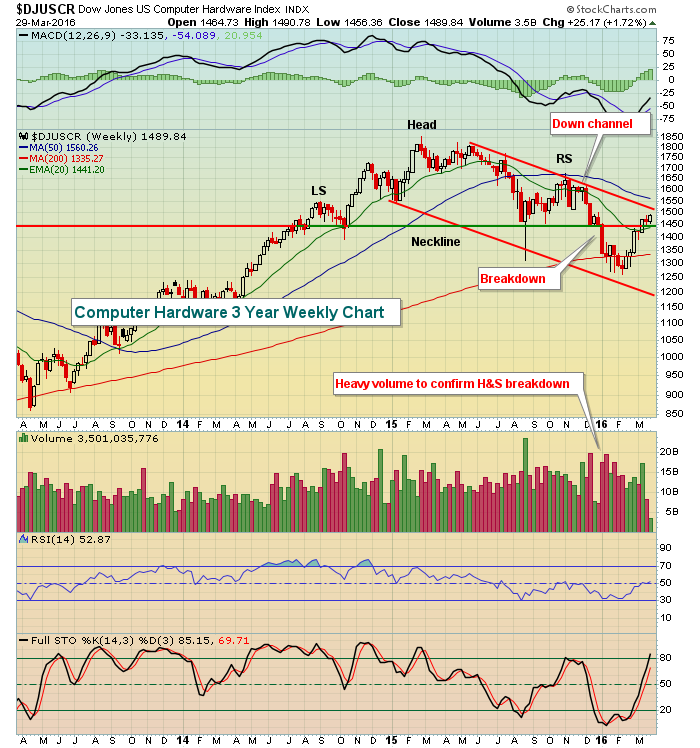 Yesterday's action was solid and the DJUSCR has performed well off the February 11th market bottom, but there are many mixed signals. First, the heavy volume selling in early January confirmed a head & shoulders breakdown and the weekly MACD was horrid during the early 2016 selling. The recovery, however, was not contained beneath neckline resistance AND the declining 20 week EMA - unusual technical behavior for sure. I would respect the breakout in this space, especially in light of the XLK's breakout to an all-time high. But.....I'd keep a tight stop if short-term technical conditions deteriorate. Let's look at the daily chart of the DJUSCR:
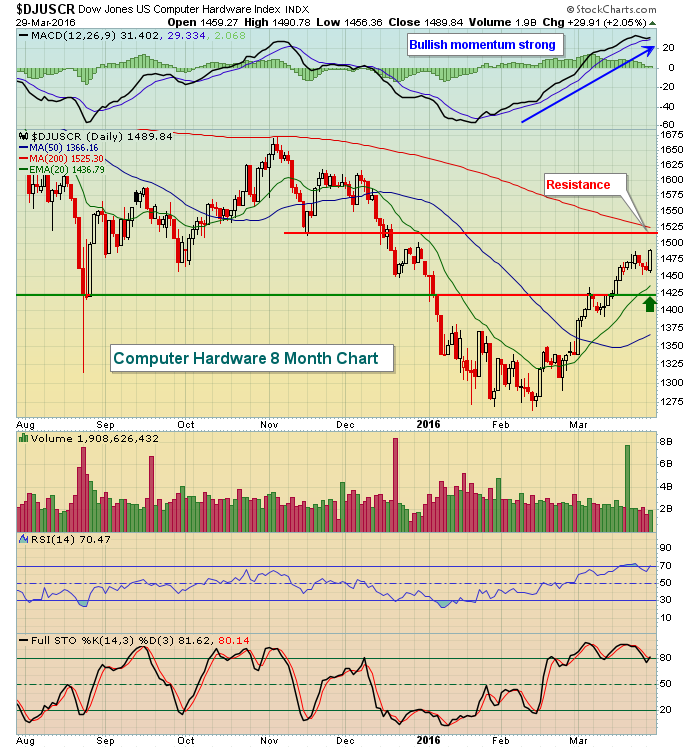 Momentum is clearly strong and that suggests that the combination of price support and the rising 20 day EMA should provide excellent support on any period of weakness. Failure to hold at those two levels could mean the down channel on the weekly chart is resuming. Therefore, the best reward to risk into this space would be close to these support levels.
Internet stocks are featured below in the Sector/Industry Watch section below.
While there was fairly broad participation across most sectors and industry groups to support Tuesday's rally, both energy (XLE) and especially financials (XLF) were notably weak. The XLF barely finished in positive territory and banks ($DJUSBK) finished down at 286.84 to threaten its March low close of 284.43. I would consider this as perhaps the biggest negative to the S&P 500's rally off the February 11th low. It would be the poor relative performance of banks or possibly the continuing decline in the 10 year treasury yield ($TNX), which dropped to 1.81% on Tuesday to close at its lowest level in March. That suggests bond traders are still very active on the buy side and that typically means economic weakness ahead. If they're right, then this equity rally is most likely going to fail.
Pre-Market Action
The 10 year treasury yield ($TNX) has moved a bit higher in early trading this morning, but why are traders jumping into treasuries and sending the corresponding yield lower in recent trade if the S&P 500 appears to be anticipating a strengthening economy by moving higher as well? Well, that's a good question and one that has yet to be answered. The short-term uptrend in the TNX that supported this equity rally has stopped in its tracks. Check it out:
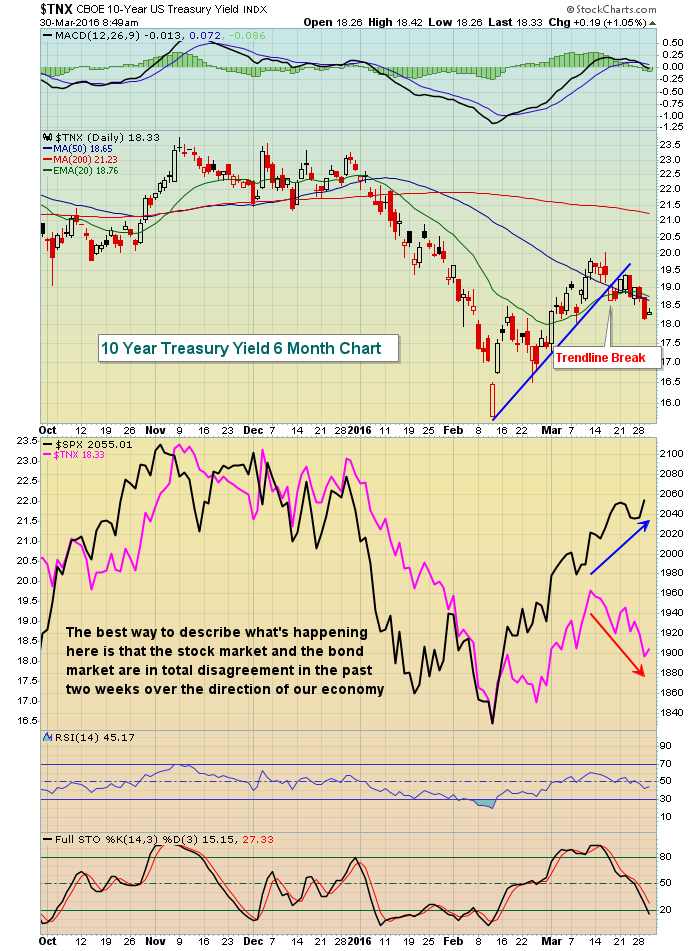 The bond market tends to be the smarter of the two markets so watching these divergence emerge is of concern, along with the weak bank performance mentioned above.
U.S. futures are strong this morning, suggesting we'll see continuation of yesterday's solid rally. Remember, we're in the latter part of a calendar month where it's quite typical of the stock market to move higher in anticipation of positive money flows to start the next calendar month.
Current Outlook
Generally speaking, a bear market results when a key benchmark like the S&P 500 drops 20% or more. At this point, the S&P 500 topped at 2134.72 on May 21, 2015 and hit its low of 1810.10 on February 11, 2016. That represents a drop of 324.62 points, or 17.93%. So is this a bear market? Well, I guess we could debate this back and forth, but there's no certain answer. If you've been heavily invested in the Russell 2000's 37.42% drop (from June 23, 2015 to February 11, 2016), I'm fairly comfortable you'd call this a horrible bear market.
Much of the S&P 500 losses can be attributable to the energy sector (XLE) where we saw a drop unlike any in recent memory. Crude oil prices ($WTIC) fell from above $60 per barrel when the S&P 500 topped to $26 per barrel as the February 11th bottom approached. That weakness prompted the selling of riskier assets late in 2015 and into early 2016. The subsequent recovery in the S&P 500 has been mostly supported by energy stocks and defensive utilities (XLU) that continue to benefit from weakening treasury yields.
Every bear market and every recovery is different and must be evaluated as such. However, if you're interested in the extent of bear market rallies during the prior two bear markets from 2000-2002 and then from 2007-2009, here they are:
September 21, 2001-December 5, 2001 (75 days in length): +24.23%
July 24, 2002-August 22, 2002 (29 days in length): +24.41%
March 17, 2008-May 19, 2008 (63 days in length): +14.58%
October 10, 2008-October 14, 2008 (4 days in length): +24.35%
November 21, 2008-January 6, 2009 (46 days in length): +27.37%
Where does this current S&P 500 rally rank?
February 11, 2016-March 29, 2016 (47 days in length....and counting): +13.53%
The primary difference between the current market environment and those prior bear markets is that the S&P 500 has not lost the "pre-requisite" 20% necessary to call this a bear market as many pundits require. Also, as I've pointed out countless times in previous blog articles, the most important technical indicator in my view is the combination of price and volume. The 1810 low established on February 11, 2016 merely tested the significant price low of 1820.66 in October 2014, then tested again at 1812.29 on January 20, 2016. In my view, the S&P 500 needs to break this price support level to confirm the bear market "conditions" we've been witnessing for the past several months. By "conditions", I'm referring to the massive rotation into defensive areas of the market that has taken place since various times in 2015 (depending on which specific relative ratio we're discussing).
At this point, I believe it's best to trade off your own personal convictions, but to keep fairly tight stops in place in the event you're wrong. The benefit of the doubt should generally go to the bullish camp because, simply put, the stock market goes higher WAAAAY more often than it moves lower. Many experts have called 14 of the last 2 bear markets.
Sector/Industry Watch
The Dow Jones U.S. Internet Index ($DJUSNS) was a heavy contributor to the bull market that began in March 2009. The group remains bullish in the longer-term as reflected on the following chart:
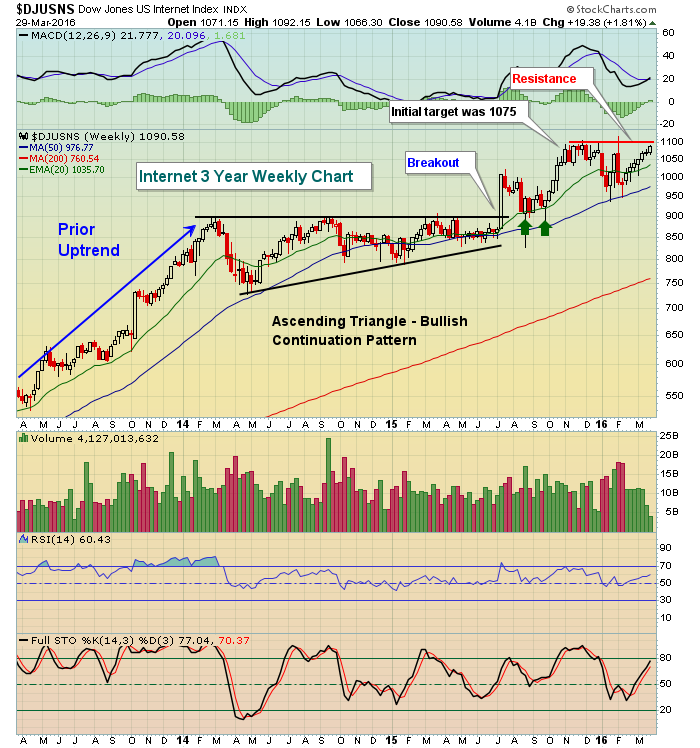 The rally off the February low has been strong and the DJUSNS is now nearing a key resistance level near 1100. Obviously, a breakout on increasing volume would add sustenance to an already strong S&P 500 rally. In fact, it's these types of industry groups where I want to see breakouts to confirm the continuation of the seven year bull market. This group shows a breakout of a prior ascending triangle pattern. Note the subsequent selling held onto price support at the level of the breakout and the measurement at 1075 was ultimately attained. How do you determine the measurement of an ascending triangle breakout? By calculating the distance between the triangle tops (900) and the initial triangle low (roughly 725), which is 175 points. Upon breakout, add the 175 points to the breakout level of 900 and you get 1075. The measurement has been made, but that doesn't mean the rally has ended. At this point, technical conditions remain strong here.
Historical Tendencies
Since 1971 on the NASDAQ, Wednesdays have produced annualized returns in excess of 25% and ranks as the best performing day of the calendar week. Those bullish results are even better when considering only Wednesdays that fall between the 25th of the calendar month and the subsequent month's 6th calendar day.
Key Earnings Reports
(actual vs. estimate):
CCL: .31 estimate (actual numbers due out this morning)
LULU: .85 vs .80
PAYX: .50 vs .50
(reports after close, estimate provided):
MU: (.08)
Key Economic Reports
ADP employment report released at 8:15am EST: 200,000 (actual) vs. 203,000 (estimate)
Happy trading!
Tom


