Market Recap for Thursday, March 24, 2016
Despite a rising dollar ($USD), energy (XLE) was the best performing sector on Thursday, posting a .49% gain, while financials (XLF) were the biggest loser, dropping .62%. Four sectors rose while four declined and materials (XLB) finished exactly where they started. The dollar did climb for the fifth consecutive day, something it hadn't done since late 2015 into early 2016. The daily chart doesn't look like anything special, but the longer-term weekly chart still has a bullish continuation pattern in place. Check both charts out:
Dollar - 10 month daily chart:
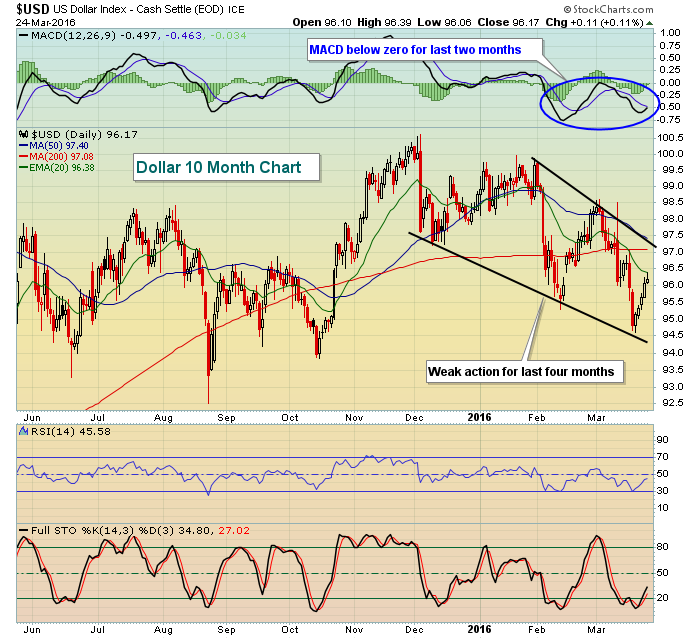 The last five days have closed higher, but the overall trend for the past four months has been lower. But now check out the longer-term weekly chart:
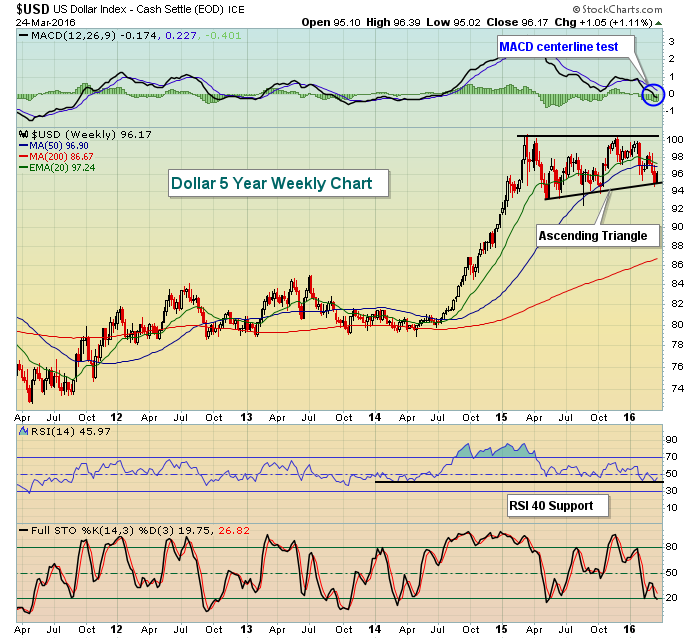 After a nine month parabolic rise, the dollar became violently overbought and was in need of consolidation or a pullback. We've seen mostly consolidation in the form of a bullish ascending triangle pattern and that provides hope to the dollar bulls that the last five days of strength could be more than just a short-term bounce.
Pre-Market Action
U.S. futures are off their best levels of the morning, but nonetheless show that U.S. stocks are set to start the week on a positive note. Asia was mixed overnight with Japan's Nikkei ($NIKK) up 0.8% while China's Shanghai ($SSEC) was down 0.7%. The Hang Seng was closed overnight. In Europe, equity markets are closed for Easter Monday.
The 10 year treasury yield ($TNX) continues to straddle the 1.90%-2.00% range.
Current Outlook
One component of the outlook that we need to consider is the historical component. We're just a little more than a month away from "Go Away In May". I'm not a big fan of this theory because May just happens to be one of the best months of the year for small caps (Russell 2000). As a shorter-term trader, there are bullish historical periods from May through October, they simply don't last as long or are as strong as what we're accustomed to during the more bullish November to April period.
Undeniably, April remains a bullish calendar month. On the S&P 500, it has risen 46 times in the last 66 years. The only calendar month to rise with more consistency is December, which has risen 49 times over that same span. In terms of annualized returns, April has posted a +17.36% return, which trails only November (+17.84%) and December (+19.48%). So April is not typically where the stock market turns south. But it has happened and it's followed by months that have not fared nearly as well. Here are the number of times the following months have risen over the past 66 years:
May: 38
June: 33
July: 36
August: 36
September: 29
And annualized returns for each month?
May: +2.44%
June: -0.03%
July: +11.75%
August: -1.06%
September: -6.17%
Considering that the S&P 500 averages roughly a 9% gain since 1950, it's rather obvious that the spring and summer months tend to face historical head winds. I've spent much time talking about the technical issues that the stock market faces, but it also is important to understand that history is not on the side of the bulls over the next several months, especially once April is behind us.
Sector/Industry Watch
Within industrials, the Dow Jones U.S. Business Support Services Index ($DJUSIV) had a huge day on Thursday, not only gaining nearly 3%, but also breaking out to an all-time closing high. Check it out:
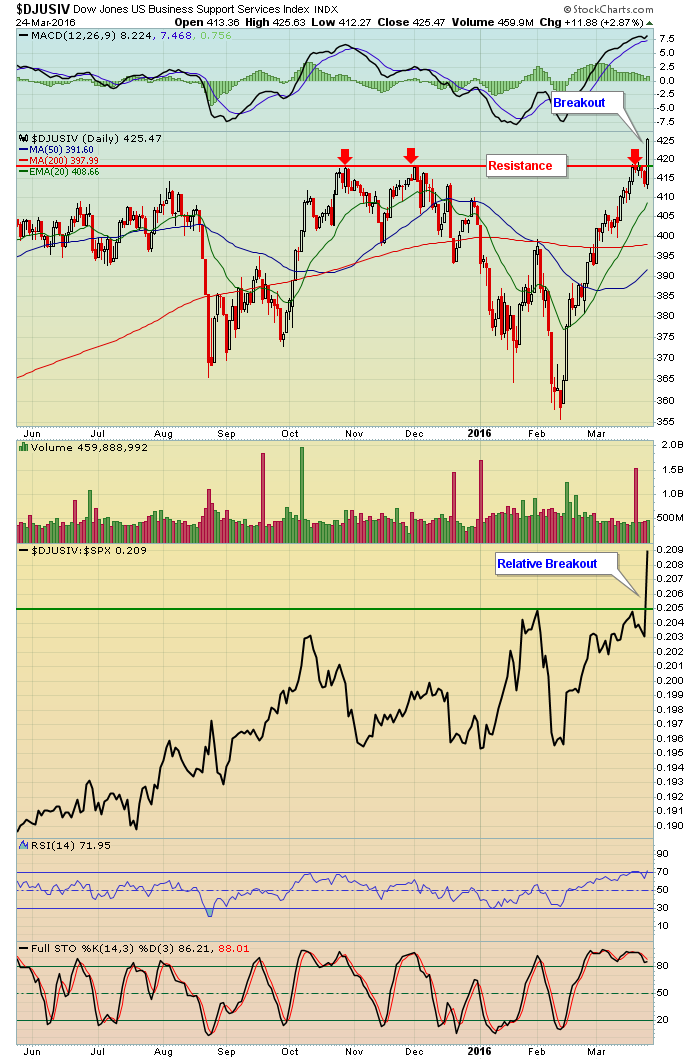 The red arrows mark triple top resistance at the 418 level that was cleared by Thursday's close. That will now mark price support, along with rising 20 day EMA support, currently at 409. In addition to making an absolute price breakout, the DJUSIV also broke out relative to the benchmark S&P 500. The reason for the strong performance could be linked to Accenture (ACN), who posted much stronger than expected revenues and earnings in its latest quarter and raised its revenue forecast.
Historical Tendencies
Since 1987, here are the annualized returns on the Russell 2000 for the following calendar periods:
25th through 6th: +26.70%
7th through 10th: -14.45%
11th through 18th: +15.26%
19th through 24th: -15.08%
Key Earnings Reports
None
Key Economic Reports
February personal income released at 8:30am EST: +0.2% (actual) vs. +0.1% (estimate)
February personal spending released at 8:30am EST: +0.1% (actual) vs. +0.1% (estimate)
February pending home sales to be released at 10:00am EST: +1.5% (estimate)
Happy trading!
Tom


