Market Recap for Monday, March 28, 2016
Monday was another day of market bifurcation with the Dow Jones, S&P 500 and Russell 2000 barely higher, while the NASDAQ suffered a minor loss. Few analysts expected the type of rally we've seen off the February 11th bottom, yours truly included. Yes, the market was set up for an extended rally, but clearing so many resistance levels has been somewhat of a shocker. The obvious question remains - has this rally run its course or are there more gains in store? Quite honestly, the answer depends on what area of the market we look at.
Transports ($TRAN) dropped .85% on Monday and that marked its fifth consecutive daily decline. The good news is that current price remains above 20 day EMA support and its MACD is bullish. There are two problems, however. One problem is that railroads lost short-term support on Monday's close. Check out the Sector/Industry Watch section below for more details there. The other problem is the airlines group. Check this out:
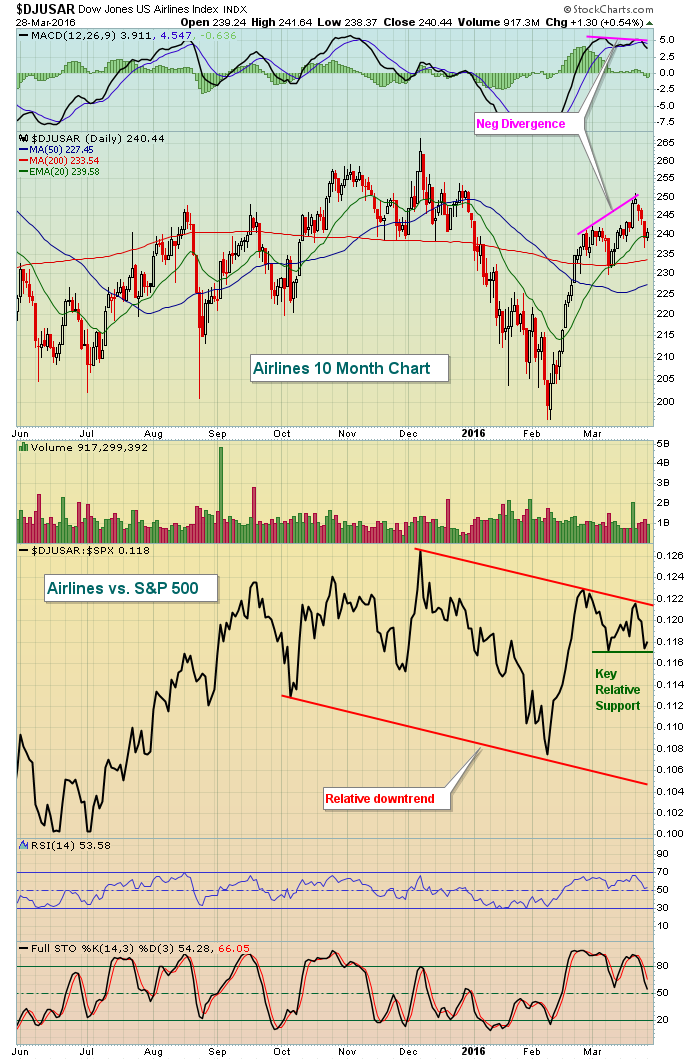 Airlines have a couple issues here. First, there's a negative divergence that printed on its latest price high and so the current rising 20 day EMA test becomes critical. Failure to hold increases the risk of a 50 day SMA test and as you can see, airlines are already in a relative downtrend vs. the S&P 500. Losing relative support would add to the potential troubles brewing in airline stocks.
Consumer stocks led the market on Monday with both staples (XLP) and discretionary (XLY) stocks performing well. Materials (XLB) also recovered on Monday from their recent downtrend as the U.S. dollar ($USD) printed a reversing bearish engulfing candle at its declining 20 day EMA. Materials will likely benefit from a tail wind as long as the dollar remains beneath its 20 day EMA.
Pre-Market Action
Mixed action took place overnight in Asia as their major markets all resumed trading after their holiday. In Europe, action is also mixed. The German DAX is what I'm watching most closely as it continues to fail at the psychological 10000 resistance level, but at the same time, keeps holding onto rising 20 day EMA support. That range is squeezing and we'll soon find out which level is cleared. That may help provide us clues as to the S&P 500's direction as the positive correlation between the S&P 500 and the DAX has been well documented here in this blog.
U.S. futures are pointing to a slightly lower open.
Current Outlook
Bull market rallies are typically supported by wide participation and a "risk on" trader mentality. In my opinion, those rallies are sustainable, meaning that I expect further price appreciation. Over the past week, eight of nine sectors have moved lower with the defensive utilities sector the only exception, climbing 0.31%.
Let's take a long-term look at the S&P 500 with several "risk on" ratios featured to see where they reside with this recent S&P 500 rally:
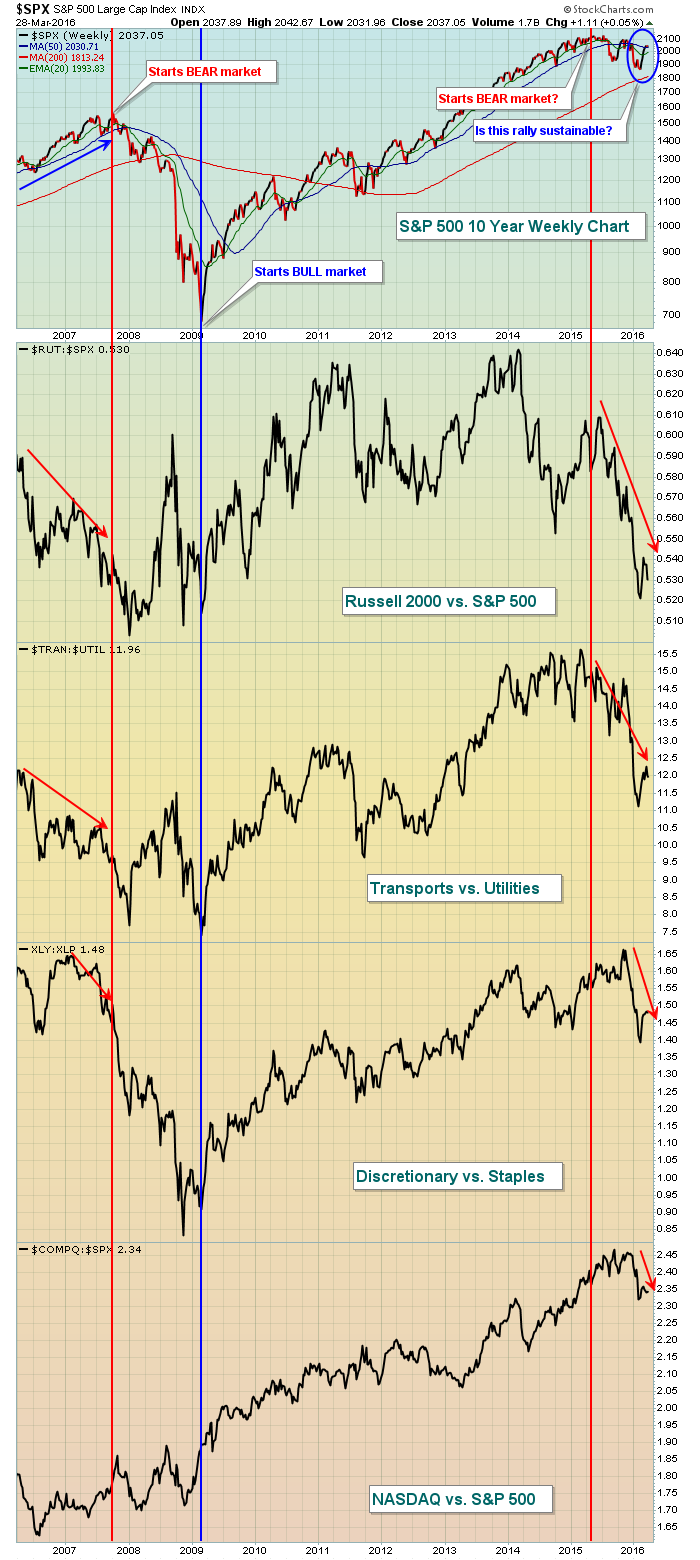 The rotation in the past several months looks eerily similar to that of 2006-2007, leading to the October 2007 top and just prior to the start of a rather severe bear market. So while we have to respect the current rally as it could certainly materialize into something even stronger, we also have to be cautious as the probabilities of a sustainable rally are diminishing given these relative ratios.
Sector/Industry Watch
The Dow Jones U.S. Railroads Index ($DJUSRR) closed below its rising 20 day EMA on Monday for the first time since crossing above this key moving average on February 4th. Its MACD remains strong as it printed a new high on the most recent price high. Therefore, a move back above that 20 day EMA would be a positive short-term sign. Another lower close, however, brings this rally into question. Check out the chart:
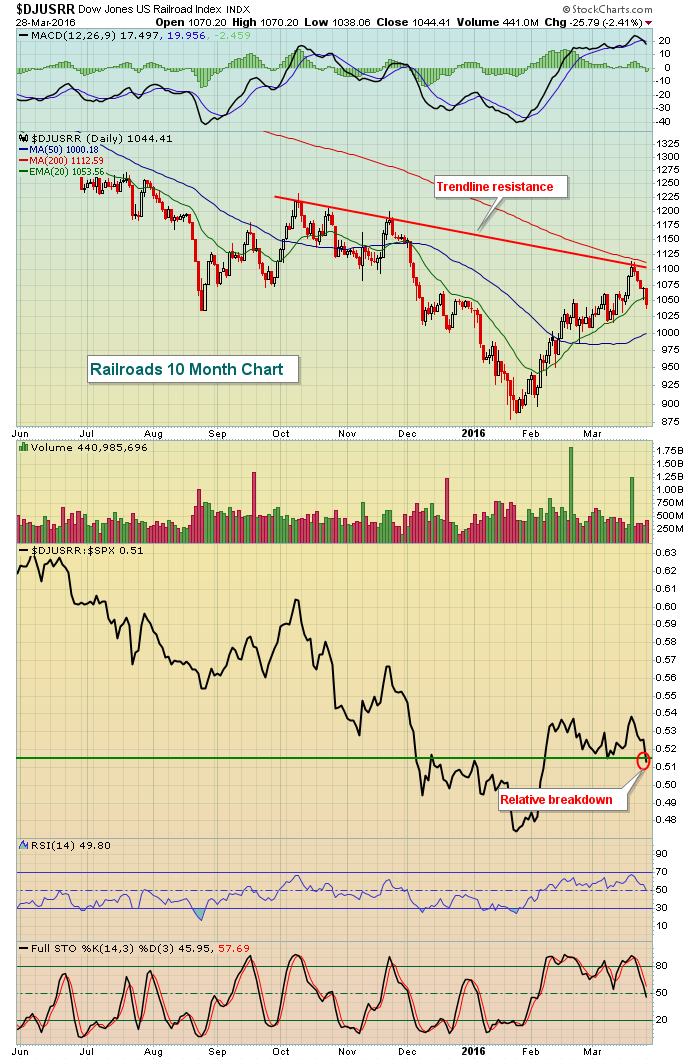 That relative breakdown, though slight, is bothersome as railroads, relative to the benchmark S&P 500, has been downtrending for a long time and this could be the resumption of that prior relative downtrend. The DJUSRR is in need of a quick recovery.
Historical Tendencies
Yesterday, I provided historical annualized returns on the Russell 2000 for various times during the calendar month. But that only represented the last 28 years. Today, I'm providing you the same breakdown on the S&P 500, which spans 66 years:
26th through 6th: +20.77%
7th through 10th: -6.53%
11th through 18th: +13.82%
19th through 25th: -8.52%
The pattern within calendar months appears rather obvious to me and should be considered if you trade in the short-term.
Key Earnings Reports
(actual vs. estimate):
LEN: .63 vs .52
MKC: .74 vs .69
Key Economic Reports
January Case-Shiller HPI to be released at 9:00am EST: +0.7% (estimate)
March consumer confidence to be released at 10:00am EST: 94.0 (estimate)
Happy trading!
Tom


