Market Recap for Tuesday, April 12, 2016
Just before Tuesday's open, the International Monetary Fund (IMF) lowered its forecast for world economic growth. Then shortly after the open, all of our major indices lost recent price support and rising 20 day EMA support. Short-term prospects were worsening and with the Volatility Index ($VIX) on the rise, it certainly appeared that the bears were finally going to have their day after weeks of waiting and waiting. It never materialized.
Remember that beaten down energy sector from the past couple years? Well, it's handling bad news very well, a solid sign that a bottom has been reached. Within an hour of the IMF's call for lowered economic growth (demand for oil should be impacted by lower world economic growth), oil surged to yet another recent high. Note how this oil surge coincided with the overall market's recovery:
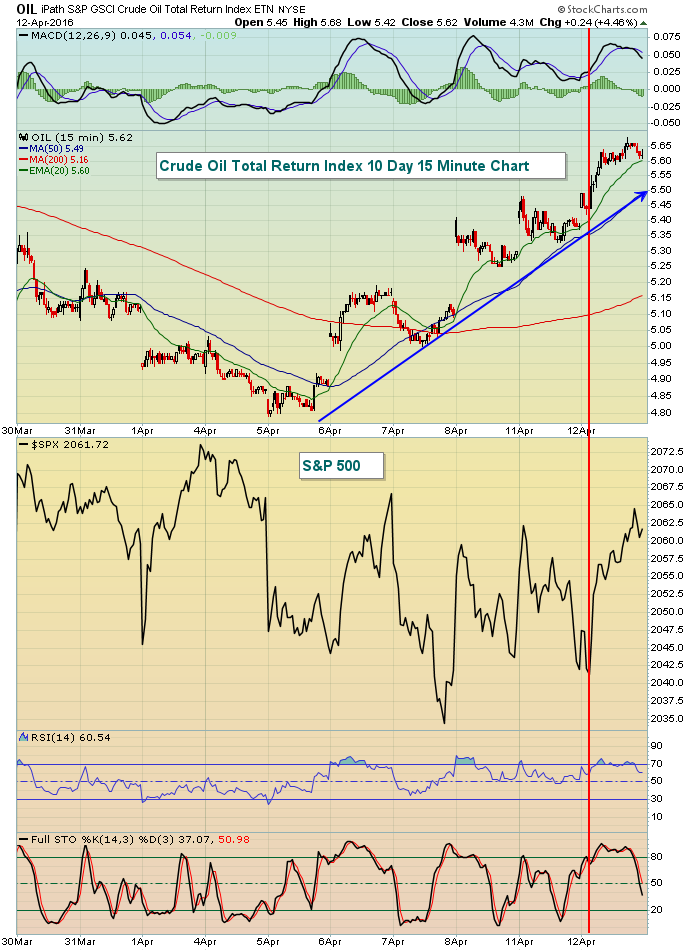 The current market environment is so different than the one we had in the second half of 2014 and throughout 2015. During those many months, the energy sector (XLE) held back the market on every breakout attempt. It was by far the worst performing sector throughout that period. From the chart above, you can see how things have changed. The XLE is now among the best performing sectors and now breakdown attempts are thwarted because of the group's improving relative strength. Watching the XLE surge the same day that the IMF lowered its world economic forecast should be solid proof of the stock market's intentions in the days and weeks ahead. Energy is the "go to" sector until proven otherwise.
The XLE rose a whopping 2.98% on Tuesday, followed by materials (XLB) and financials (XLF), which rose 1.39% and 1.26%, respectively. It was a welcome reprieve to see industry groups like life insurance (+2.13%) and banks (+1.81%) perform well, but those groups have much more work to do technically - unlike energy.
Pre-Market Action
Yesterday, the U.S. stock market rebounded from potentially poor fundamental news (reduced forecast from IMF). Today, they'll get their next challenge - lower than expected March retail sales. Consensus estimates looked for +0.1%, but instead the actual reading was -0.3%. Excluding autos, March retail sales jumped +0.2%, but that was half the expected +0.4% reading. Offsetting this poor economic news was the reaction to JP Morgan Chase's (JPM) quarterly earnings report as JPM is higher by approximately 2.5% this morning. This positive reaction should continue to aid banks ($DJUSBK) as they struggle to clear their significant 290-300 resistance zone.
Global markets surged overnight and that strength continues in Europe this morning. U.S. futures are higher as well, looking to extend Tuesday's rally.
Current Outlook
Yesterday provided a perfect example of how difficult it can be for the bears to regain control of the price action despite all of the warning signs. The NASDAQ 100 continues to show solid momentum as its daily MACD has risen with each price high. Here's the daily view:
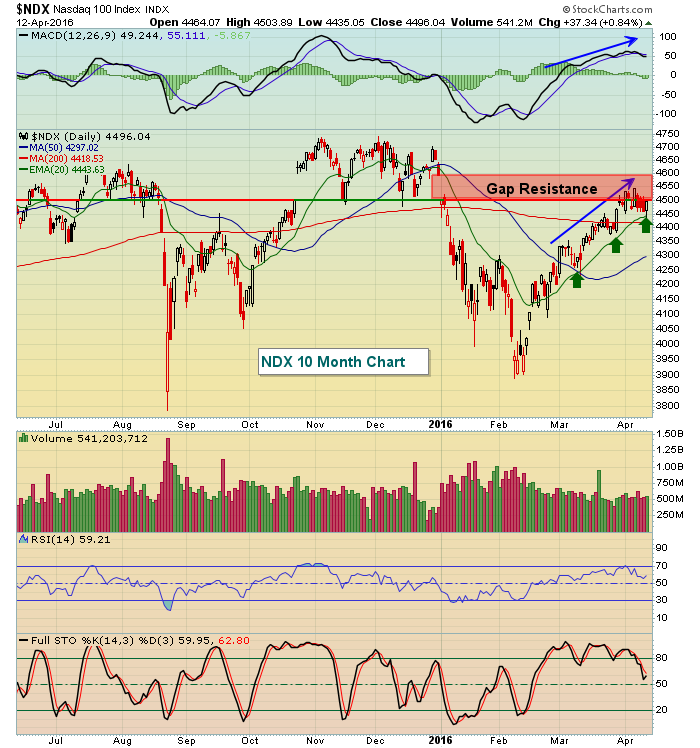 The NDX is having difficulty negotiating gap resistance in the 4500-4600 area, but it refuses to give up 20 day EMA support either. The blue arrows show that the daily MACD has risen to support every price move higher. The MACD has turned lower with this pullback so perhaps it won't support price if the NDX breaks out again. It's too early to tell. Note that Tuesday's rally began almost the second it touched 20 day EMA support, currently at 4443. It's easier to see the rebound on an intraday chart. Look at how the buyers returned as soon as the NDX dipped into the 4430s:
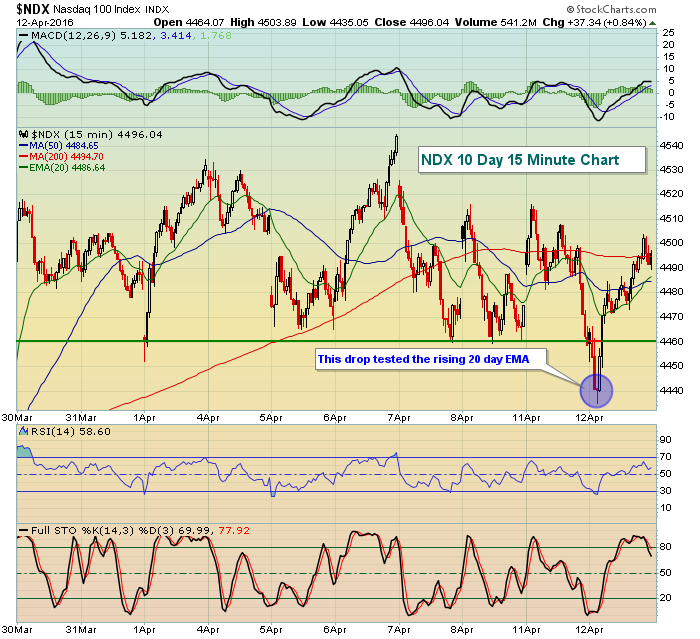 The NDX lost fairly important short-term price support near 4460 (horizontal line), but after a quick subsequent selloff, buyers returned as the 20 day EMA was tested.
Those 20 day EMAs remain a very solid and critical short-term support level for the bulls. Obviously, they remain the bears worst enemy.
Sector/Industry Watch
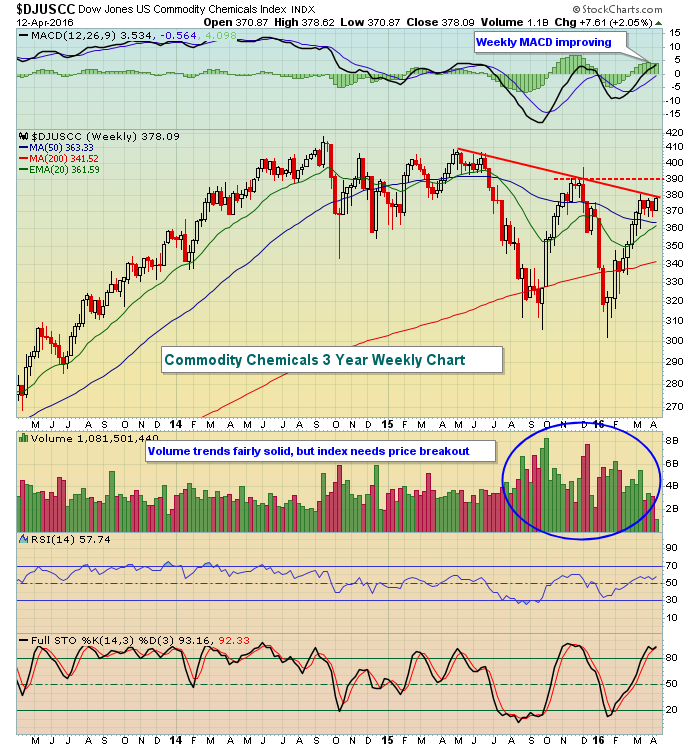
Commodity chemicals ($DJUSCC) have gained nearly 14% over the past three months and approaching trendline and price resistance. Breaking out will be important to component stocks like Air Products & Chemicals (APD) and DuPont (DD). Here's the long-term weekly look at the DJUSCC:
 .......and here's the daily view on APD, attempting to make its breakout:
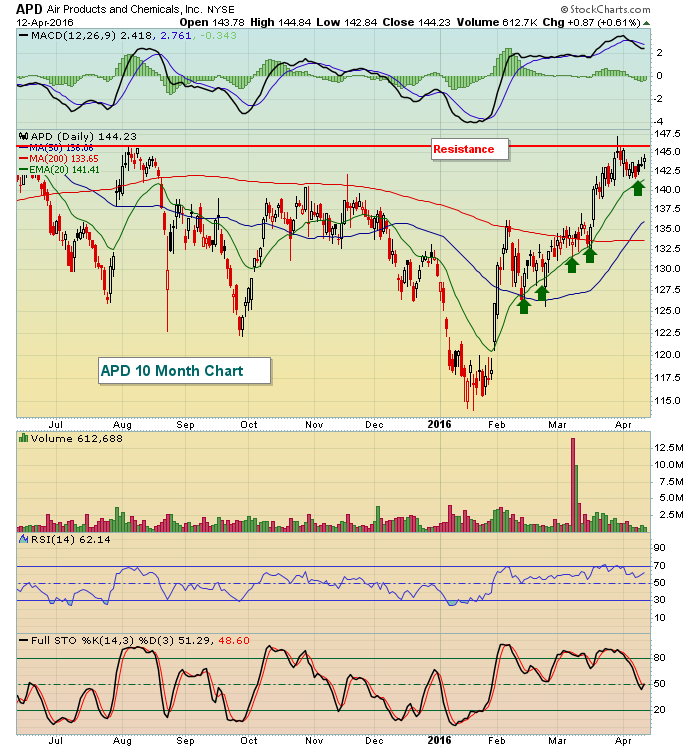 The green arrows show APD holding rising 20 day EMA support throughout the current advance while the red horizontal line shows APD's failed attempt to clear price resistance.
Historical Tendencies
April is the 3rd best calendar month of the year on the S&P 500 since 1950, producing an annualized return of 17.36%.
Key Earnings Reports
(actual vs. estimate):
JPM: 1.35 vs 1.26
Key Economic Reports
March retail sales released at 8:30am EST: -0.3% (actual) vs. +0.1% (estimate)
March retail sales less autos released at 8:30am EST: +0.2% (actual) vs. +0.4% (estimate)
March PPI released at 8:30am EST: -0.1% (actual) vs. +0.3% (estimate)
March Core PPI released at 8:30am EST: -0.1% (actual) vs. +0.2% (estimate)
February business inventories to be released at 10:00am EST: -0.1% (estimate)
Beige book to be released at 2:00pm EST
Happy trading!
Tom


