Market Recap for Friday, April 15, 2016
The last significant top on the Dow Jones occurred on November 3rd when it posted an intraday high of 17978 and closed at 17918. The action late last week challenged those two levels when the Dow Jones hit an intraday high of 17962 and closed at 17926. All of this took place just beneath the psychological 18000 level. The problem late last week is that the test of price resistance coincided with a negative divergence on its MACD. Here's the visual:
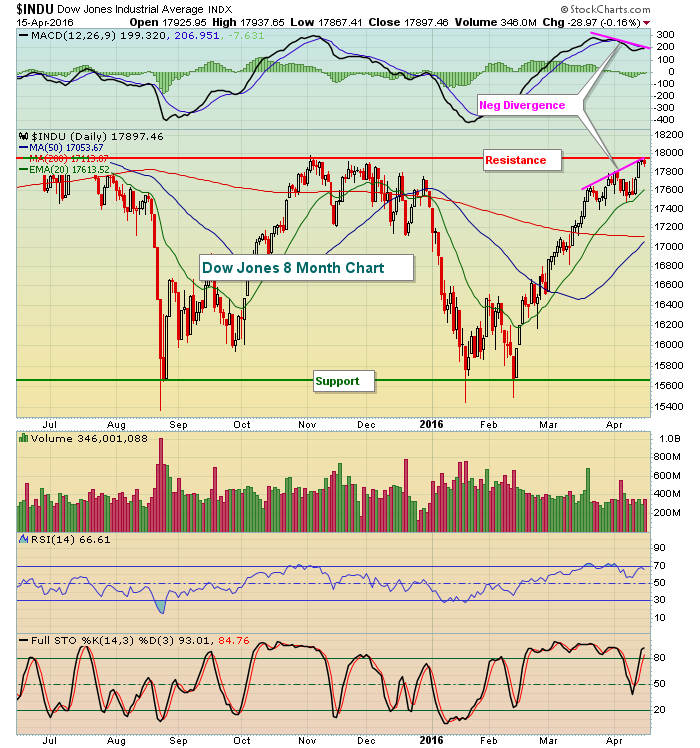 The volume this month has also been light, another sign of slowing momentum on the Dow.
Money rotated toward defense on Friday as consumer staples (XLP) and utilities (XLU) led the action. Energy (XLE) struggled, losing 1.35%, as the XLE seems to either lead or lag on a relative basis every day. Friday the energy bears took over. Technically, however, the XLE looks solid in the short-term
Pre-Market Action
The one week uptrend in the 10 year treasury yield ($TNX) ended late last week as money became more defensive - not a good sign. The TNX is higher by 2 basis points this morning, but the 2016 downtrend makes me nervous, particularly the drop in yields since mid-March.
Overnight, Tokyo's Nikkei index ($NIKK) tumbled more than 3% as it reacted to weakness in oil (down 4% at last check) and strength in the yen. The earthquakes also shook equity markets overnight as both the China Shanghai ($SSEC) and Hong Kong Hang Seng ($HSI) fell in sympathy.
In Europe this morning, major indices are fractionally higher.
U.S. futures are weak this morning as a parade of earnings has begun. Most results this morning have been better than expected. It will be interesting to see if money rotates back towards offense if strength resumes in our major indices. Key reports from IBM and Netflix (NFLX) come after the bell tonight.
Current Outlook
In the very short-term, I'll be watching a few key levels of support on the NASDAQ. At the most recent high on its 60 minute chart, the MACD was quite strong and Friday's test of rising 20 hour EMA support was successful. Based on current futures, it appears the NASDAQ could open beneath this hourly moving average. If so, two price support levels will come into play - the first at its recent breakout near 4920, then its second at the top of gap support (4904). Here's the short-term 60 minute chart:
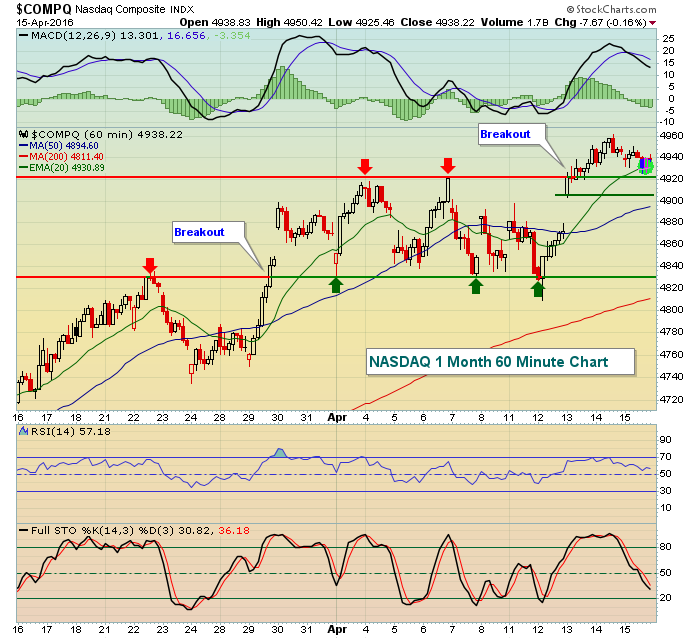 Failure to hold 4904 becomes much more problematic on the daily chart where the NASDAQ printed a negative divergence on its most recent price high. Broken resistance becomes support. Many times selling will accelerate if support doesn't hold, especially when there's a negative divergence on the MACD. Also, keep in mind we're heading into the traditionally weaker 19th-25th period of the calendar month so losing price support could be particularly troublesome this time of the month.
The caution flag remains out.
Sector/Industry Watch
The Dow Jones U.S. Travel & Tourism Index ($DJUSTT) appears to be running out of steam to the upside as it now trades in a fairly narrow 500-550 trading range. I would assume the overall downtrend continues until 550 is cleared. Take a look:
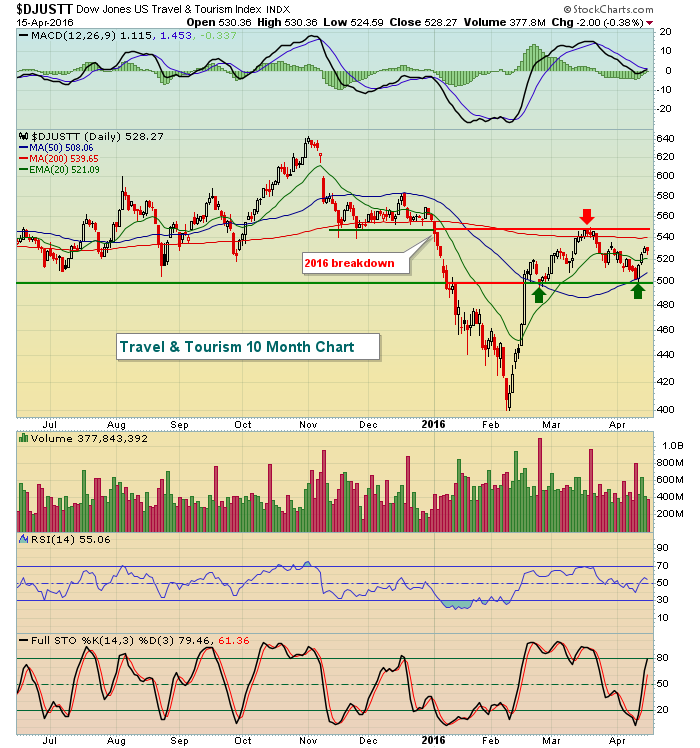 The bottom last week occurred with a bullish engulfing candle at both price and rising 50 day SMA support. Closing beneath 500 would also mean losing its 50 day SMA, a bearish signal.
Historical Tendencies
March and April have tended to be quite strong calendar months for the Dow Jones U.S. Residential REIT Index ($DJUSRN). April had started off quite rough, but a bullish engulfing candle printed on Friday, which could signal a change of fortune for the group. Here's the seasonal record for the DJUSRN:
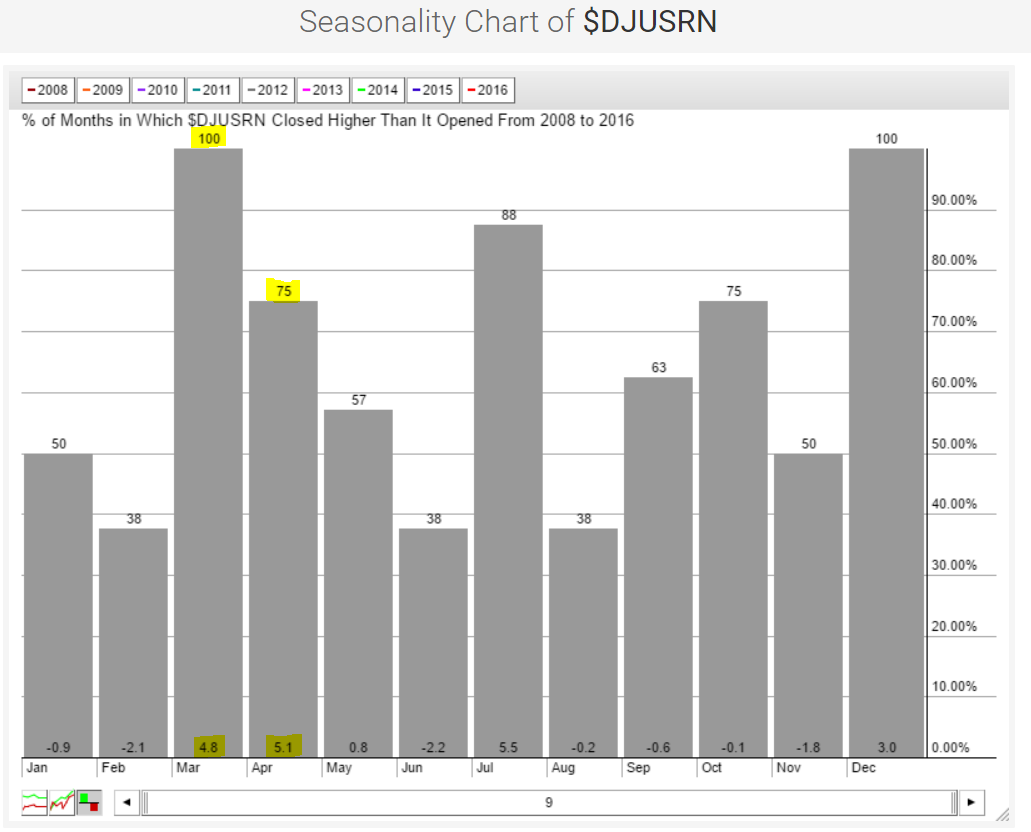 The DJUSRN has risen every year in March and has risen 75% of Aprils over the past decade or so. At the bottom of the above chart, you can see that the average monthly return has been 4.8% and 5.1% for March and April, respectively.
Key Earnings Reports
(actual vs. estimate):
GWW: 3.18 vs 2.86
HAS: .38 vs .24
JBHT: .88 vs .85
MS: .55 vs .46
MTB: 1.87 vs 1.86
PEP: .89 vs .81
(reports after close, estimate provided):
CE: 1.52
IBM: 2.07
NFLX: .03
Key Economic Reports
April housing market index to be released at 10:00am EST: 59 (estimate)
Happy trading!
Tom


