Market Recap for Wednesday, April 13, 2016
Wednesday was arguably the best trading day of 2016 for U.S. equities. Volume increased to nearly 2 billion shares on the NASDAQ and the four offensive sectors - financials, industrials, consumer discretionary and technology - led the rally with gains of 2.27%, 1.49%, 1.41% and 1.02%, respectively. The combination of (1) breaking out during an uptrend, (2) surging volume and (3) offensive leadership is what's been missing throughout much of the past year, but certainly the past 5-6 months. It was also noteworthy to see the Russell 2000 leading our major indices higher as that small cap index posted a very impressive 2.19% gain yesterday.
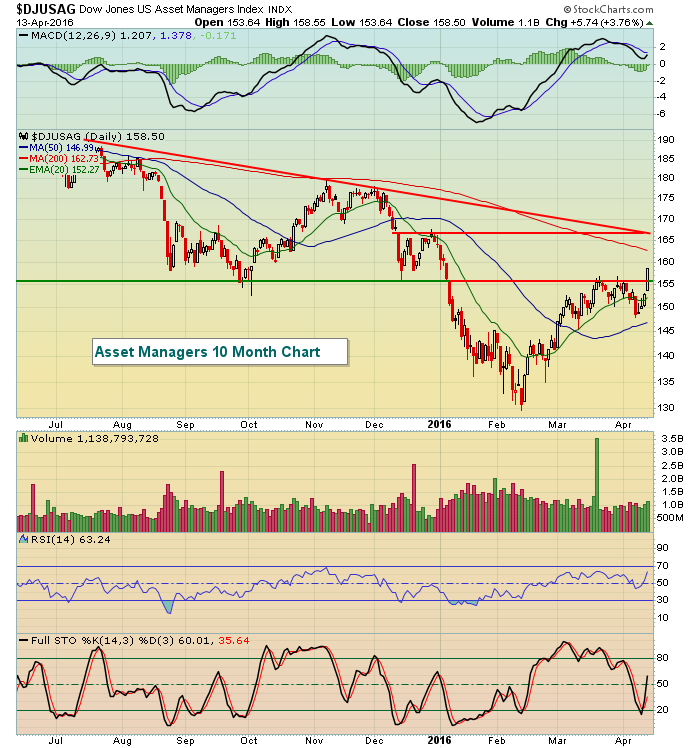
Leading the financials were asset managers ($DJUSAG). It was mentioned previously that this group was approaching key price resistance. On Wednesday, that resistance was cleared. Check this out:
 It would seem the next likely target would be 167, but Blackrock (BLK) reported disappointing results from within this space earlier this morning so we'll need to see if the 155 support level holds first.
Pre-Market Action
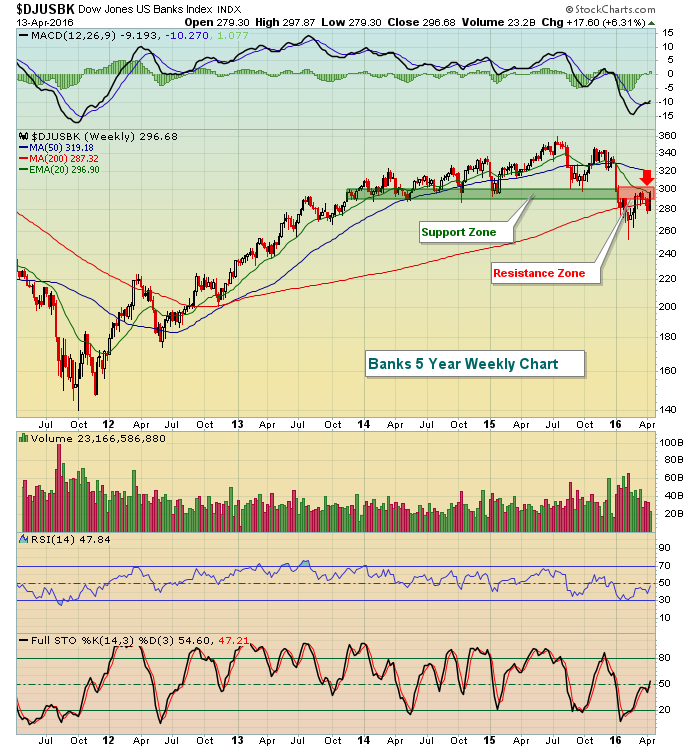
Today will be very interesting in the financial sector. JP Morgan Chase (JPM) posted solid results to kick off earnings season for banks and financials surged to lead the market higher. The Dow Jones U.S. Banks Index ($DJUSBK) had its third best day of 2016 and prepared the group for a HUGE test of price resistance after climbing 3.74% on Wednesday. Here's a look at resistance on the long-term weekly chart:
 This morning, in pre-market action, we've seen Bank of America (BAC) and PNC Bank (PNC) fall short of earnings expectations and they are lower by roughly 1.0% and 2.4%, respectively. Wells Fargo (WFC) topped bottom line expectations and is down 1.4%. If the DJUSBK can clear the resistance zone above with poor earnings results today, it would obviously be very bullish action. It makes sense, however, to respect that resistance zone until it's cleared.
Action overnight in Asia was quite bullish with the Tokyo Nikkei ($NIKK) up another 500 points, or more than 3%. Hong Kong's Hang Seng Index ($HSI) tacked on further gains after breaking out in its previous session and China's Shanghai ($SSEC) continued its slow and steady march higher.
In Europe this morning, the German DAX remains slightly above the 10000 level and is challenging recent highs. A breakout there would add to the bullishness we saw yesterday with the S&P 500 breaking out above recent highs. European indices are clinging to fractional gains this morning thus far.
The 10 year treasury yield ($TNX) is up nearly 3 basis points to 1.79% in early trading as money continues its short-term flow away from the defensive treasuries.
Current Outlook
While action the past two days has been very solid and appears sustainable - at least in terms of participation - there remain issues we cannot ignore. For instance, on the last breakout we saw negative divergences emerge on the Dow Jones, S&P 500 and Russell 2000. On Wednesday's breakout, those negative divergences are even more pronounced. And as an added kicker, the NASDAQ and NASDAQ 100 have printed negative divergences as well. Financials (XLF) broke out with a negative divergence. Industrials, technology and consumer discretionary are on the cusp of breakouts and are likely to print negative divergences if breakouts occur there. So how do you trade bullish breakouts with negative divergences?
Delicately.
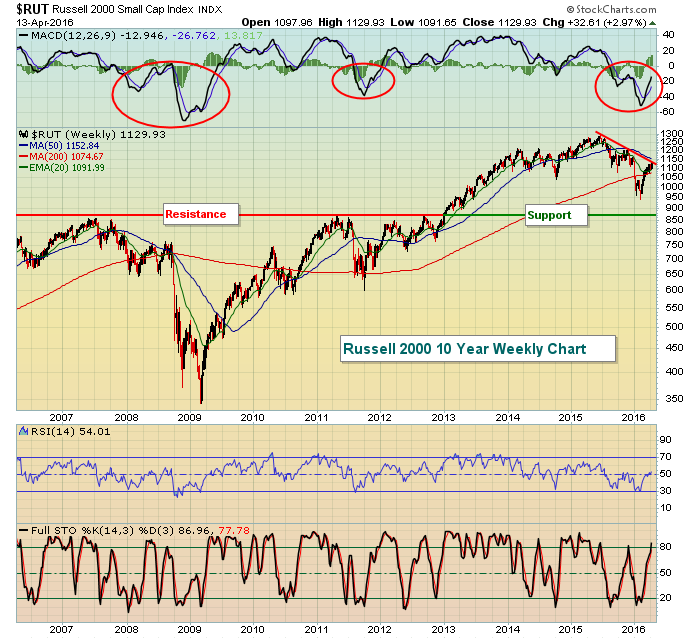
Keep in mind that long-term charts appear to be rolling over and many are trending lower. Perhaps the most obvious is in the small caps area. Take a look at the weekly chart on the Russell 2000:
 Those three red circles around the weekly MACD represent the three periods over the past decade where the bears have been in control of the momentum. If you look back to the end of the third quarter in 2008, the RUT was rallying only to be rebuffed near a confluence of moving averages and then we saw a final selloff that took us to the depths of the 2007-2009 bear market. In 2011, however, the selling was contained in a "correction" and prices surged higher and extended the existing bull market. Which path will we take this time? I generally give the bulls the benefit of the doubt because prices tend to move higher over time. But we do need to note that price on the RUT is close to 875 and could be tested during this period of weakness and the bearish summer months lie directly ahead.
So here's my conclusion. Negative divergences appear on the daily charts and rising 20 day EMAs stubbornly refuse to be lost. I'd be okay trading on the long side, but my stops would be in place. No excuses. Keep this long-term chart in mind and think about the potential losses if the weakness over the past year resumes.
Sector/Industry Watch
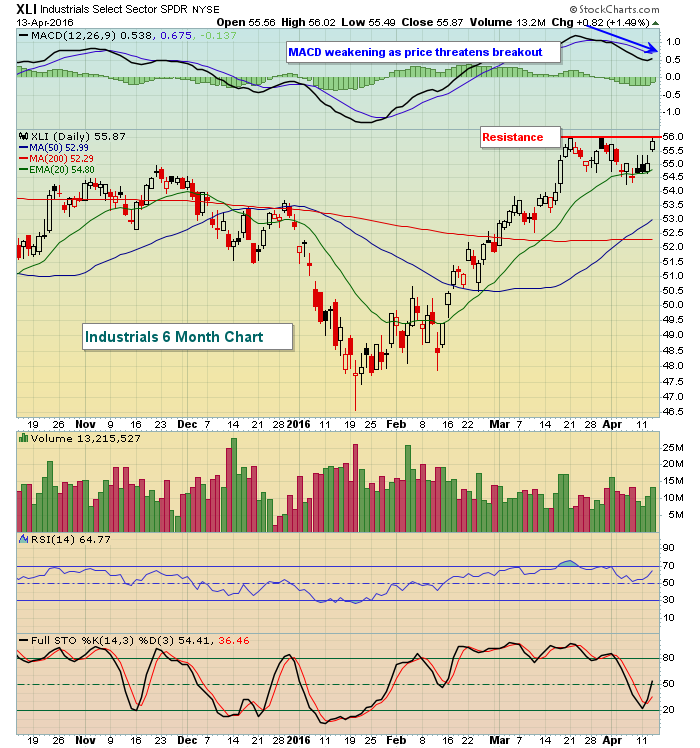
Industrials have been performing very well, but have yet to break out. Should they do so, it will almost certainly occur with a negative divergence in play. Take a look at the chart:
 Nothing is easy in the U.S. stock market right now and the above chart is further proof. Price breakouts on solid volume are always bullish in my view. But failure to hold breakout levels and rising 20 day EMAs with negative divergences in play can be troublesome. So if you trade breakouts, just make sure to keep stops in play under key price support levels/rising 20 day EMAs.
Historical Tendencies
A few days ago I posted the breakdown of performance on the Russell 2000 between April 1-15 and April 16-30, showing that small caps tend to perform much better during the second half of April. Below is a summary of how the NASDAQ breaks down between the two halves of April:
April 1-15: +4.69%
April 16-30: +30.42%
Key Earnings Reports
(actual vs. estimate):
BAC: .21 vs .22
BLK: 4.21 vs 4.25
DAL: 1.32 vs 1.29
PNC: 1.68 vs 1.69
WFC: .99 vs .98
Key Economic Reports
Initial jobless claims released at 8:30am EST: 253,000 (actual) vs. 267,000 (estimate)
March CPI released at 8:30am EST: +0.1% (actual) vs. +0.2% (estimate)
March Core CPI released at 8:30am EST: +0.1% (actual) vs. +0.2% (estimate)
Happy trading!
Tom


