Market Recap for Monday, May 16, 2016
Monday saw a very solid advance across the board, but clearly was led once again by materials (XLB, +1.72%) and energy (XLE, +1.69%). These two sectors were not only the leaders yesterday, but they also represent the top two performing sectors over the past week, month and three month periods. The XLB recently held price support and its 50 day SMA and now appears to be turning higher to challenge its recent high. Here's the chart:
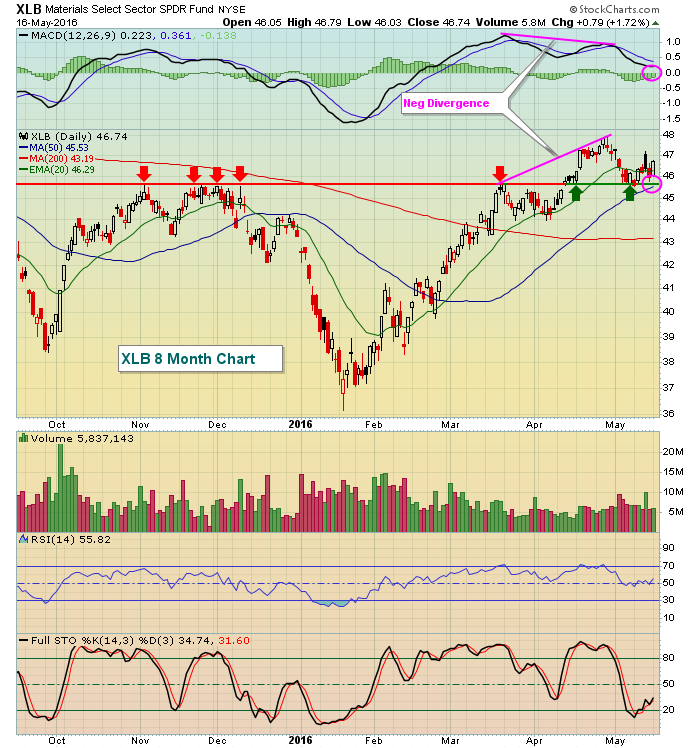 The red arrows mark multiple attempts to clear price resistance near 45.60. Generally speaking, the more failed attempts, the stronger the resistance AND the stronger the support once the resistance is broken. After finally clearing 45.60, note how that level has held as support during market weakness (green arrows). Also, the recent sideways consolidation was to be expected given the emergence of a negative divergence on the latest price high. I look for a 50 day SMA test and/or MACD centerline test (pink circles) after a negative divergence prints. The 50 day SMA has been rising and now confirms price support.
Utilities (XLU, +0.12%) rose but were easily the weakest sector on Monday, hurt by a rebound in the 10 year treasury yield ($TNX)
Pre-Market Action
Economic data this morning was mixed with solid housing starts, but with an uptick in inflation. Oil prices are struggling to hold onto recent gains and the energy space has been the relative leader the past few months so this struggle is putting a little pressure on U.S. futures, which are down very slightly as we prepare to open for the second day of trading this week.
Global markets are mixed as well, although both the Tokyo Nikkei ($NIKK) and Hong Kong Hang Seng ($HSI) managed to add more than 1% overnight.
Home Depot (HD), Children's Place (PLCE) and The TJX Companies (TJX) are all higher this morning after solid quarterly earnings results and hope to put a halt to the recent weakness in retail stocks.
Current Outlook
The battle rages on. The S&P 500 closed at 2067 on Monday and the S&P 500's all-time high close of 2131 occurred on May 21, 2015. Over the past year, the S&P 500 is down 64 points, or approximately 3%. While we've gone basically nowhere, both the bulls and bears continue to point to reasons why they're each right. And honestly, I can debate both sides of this argument. Technically, there are reasons to believe both sides. The sideways consolidation over the past 18 to 24 months supports a breakout to the upside. Check this out:
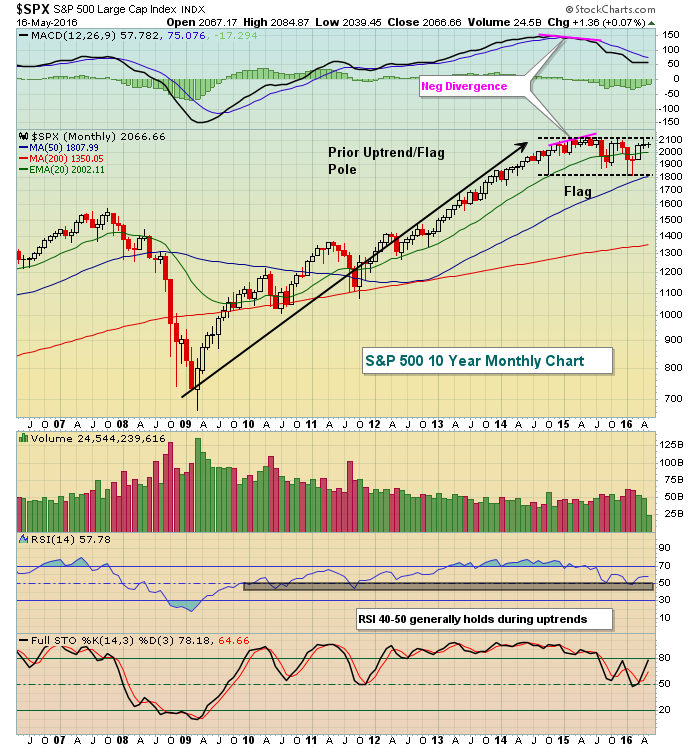 From a bullish perspective, we've simply been consolidating for two years AFTER a prior uptrend that began in March 2009. These types of patterns are typically considered continuation patterns, suggesting the most likely break from consolidation is the direction of the prior trend - or higher. Note on this chart the emergence of a negative divergence. A negative divergence on a monthly charts takes a long time to unwind, but you can see that the 50 month SMA has now risen up to major price support from the price lows over the past 18 months or so. That level is very significant for short-, intermediate- and long-term investors/traders.
The bears will tell you that yes we're flirting with all-time highs on the S&P 500, but the under the surface action has been deteriorating rapidly and suggests that we all exit stage left. Take a look at a slightly different view of the S&P 500 over the past 10 years:
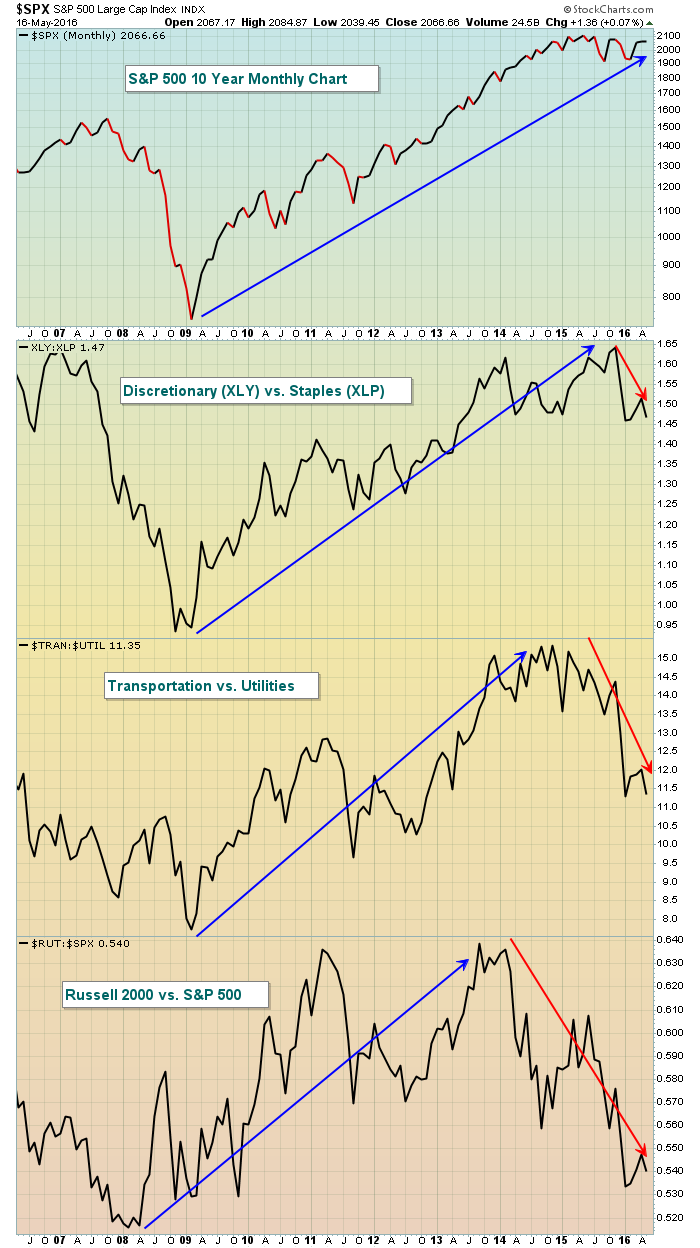 The relative ratios shown above tend to rise along with the S&P 500 and that generally suggests that the S&P 500 rally is sustainable. Why? Because it reflects an appetite for risk, a necessary ingredient for a rising market. The problem now, as the bears will argue, is that the S&P 500 consolidation is occurring as money rapidly exits riskier areas of the market and moves into defensive areas. Defense may win sports championships, but it rarely wins stock market battles.
The shift toward defense certainly encourages us to be cautious, but this consolidation period could break in either direction. That combination of price/volume is the most important indicator in the market and it will have the final say in which way the S&P 500 ultimately breaks. For now, we remain in an 1810-2131 long-term trading range where anything in the range is possible.
Sector/Industry Watch
Medical supplies ($DJUSMS) continues to act quite bullishly and had a very nice day on Monday. Here's an update of the technical outlook:
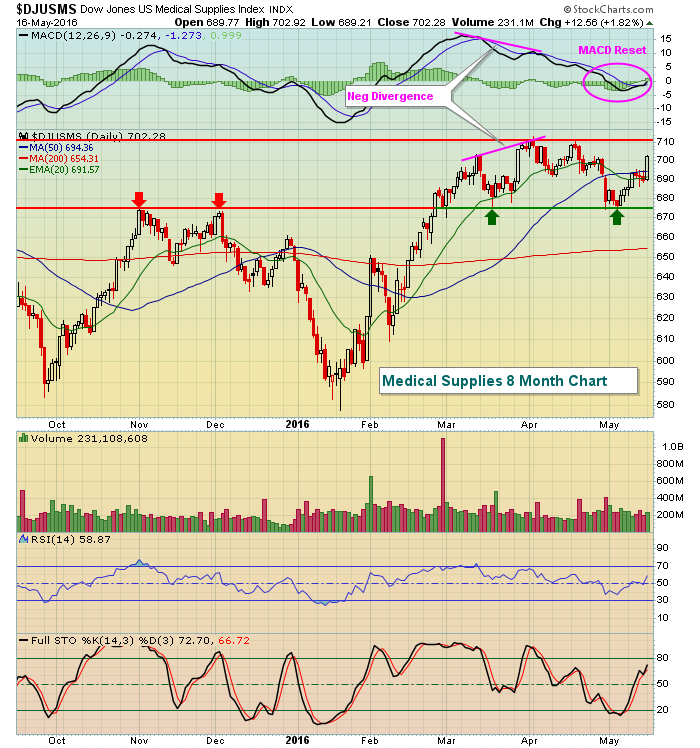 The action here has been quite predictable. The breakout above 675 was significant, but then a negative divergence printed, suggesting that the DJUSMS needed time to unwind and consolidate, which it did by testing price support at 675 on a couple occasions. The prior momentum issues have been resolved now with the MACD reset at centerline support. So long as the DJUSMS holds price support, I'd be bullish this industry group.
Historical Tendencies
The following shows the seasonal pattern for the DJUSMS:
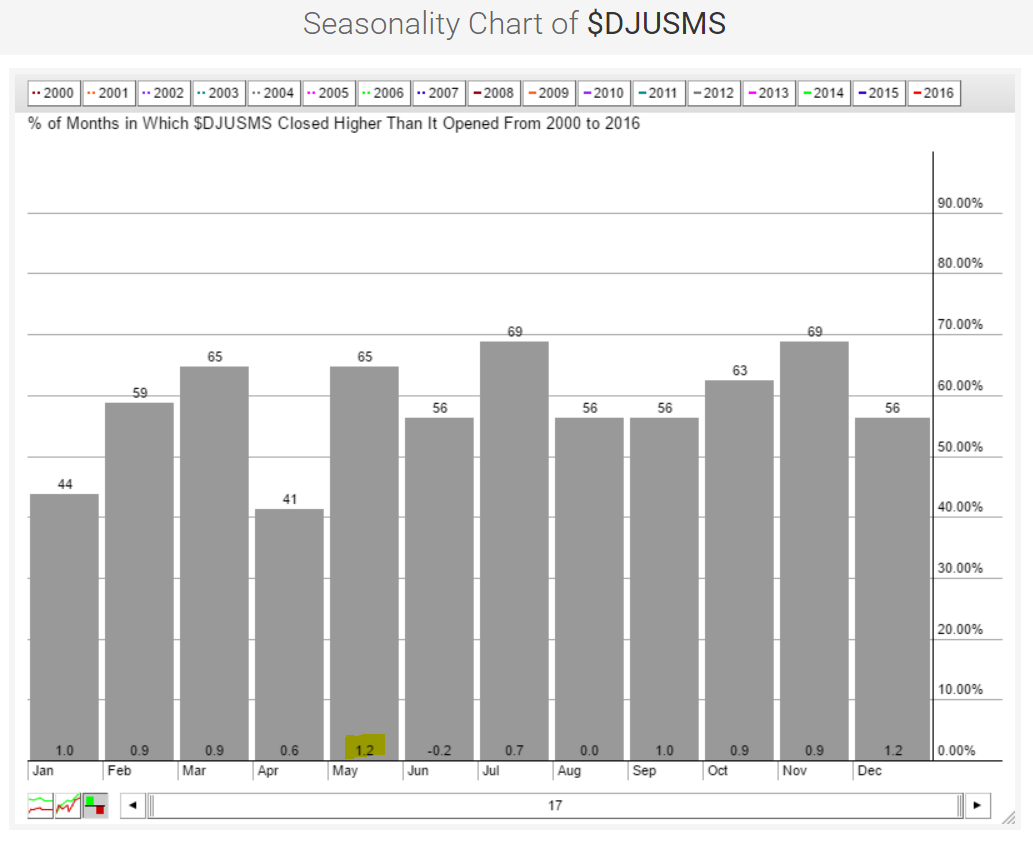 May's average return of +1.2% ties December for the best calendar month performance for medical supplies companies. And while returns aren't hugely positive over the summer months, they show little weakness. Accordingly, this area of the market, while technically sound, is an area to consider trading on the long side.
Key Earnings Reports
(actual vs. estimate):
HD: 1.44 vs 1.34
PLCE: 1.32 vs 1.03
RRGB: 1.27 vs 1.10
TJX: .76 vs .70
Key Economic Reports
April CPI released at 8:30am EST: +0.4% (actual) vs. +0.3% (estimate)
April Core CPI released at 8:30am EST: +0.2% (actual) vs. +0.2% (estimate)
April housing starts released at 8:30am EST: 1,172,000 (actual) vs. 1,135,000 (estimate)
April building permits released at 8:30am EST: 1,116,000 (actual) vs. 1,130,000 (estimate)
April industrial production to be released at 9:15am EST: +0.2% (estimate)
April capacity utilization to be released at 9:15am EST: 74.9% (estimate)
Happy trading!
Tom
