Market Recap for Friday, May 13, 2016
I suppose it's only fitting that all of our major indices close beneath their 50 day SMAs simultaneously for the first time on Friday the 13th. The NASDAQ has been trading beneath its 50 day SMA for the past several trading sessions, but the others - the Dow Jones, S&P 500 and Russell 2000 - joined it on Friday. The NASDAQ has certainly been trading poorly on a relative basis and, in fact, just closed at a fresh relative low vs. the S&P 500 on Friday, clearing the low that was established when U.S. stocks closed at February lows. Check this out:
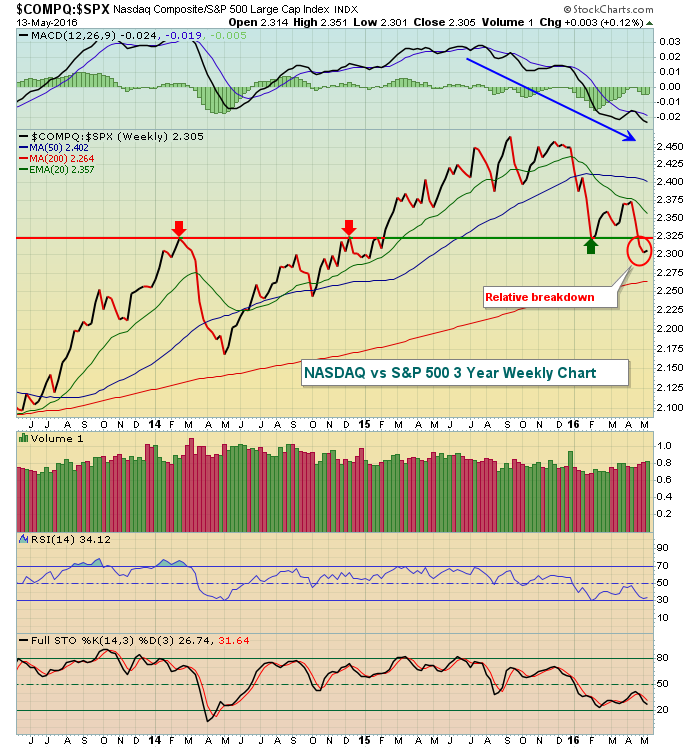 The significance is that the more aggressive NASDAQ generally rises on a relative basis vs. the S&P 500 during a bull market. So the relative breakdown really brings this recent rally into question, not to mention the longer-term question of whether we're in a continuing bull market or beginning a fresh bear market.
The bears inflicted technical damage on Friday as all of our major indices closed beneath their 50 day SMAs for the first time since climbing above in late February. Considering the loss of 50 day SMA support occurred after a negative divergence emerged could signal more weakness ahead. The onus is certainly on the bulls now to push prices back above that key moving average. The bulls do still have price support on a couple major indices that should help. As an example, the S&P 500 has been holding above the 2025-2050 zone throughout the past few bouts of selling. Here's the visual:
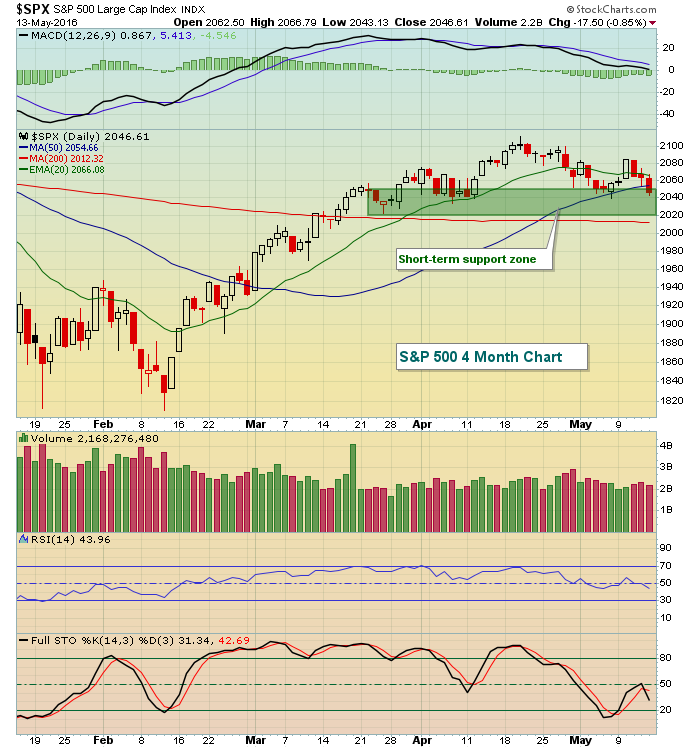 It wasn't highlighted on the above chart, but you can see that Friday's close was just beneath the S&P 500's rising 50 day SMA. The first test for the bulls will be establishing the price action back above this key moving average.
Pre-Market Action
Asian markets finished fractionally higher overnight despite economic data in China that suggested their economy remains under pressure. The German DAX ($DAX) is closed today, but both the French CAC ($CAC) and London FTSE ($FTSE) are lower this morning by 0.77% and 0.41%, respectively, at last check.
In the U.S., futures are hovering near the flat line. Futures were up earlier, but traders seemed to be disappointed after the Empire Manufacturing Survey report came in much weaker than expected and those futures have backed off earlier highs.
The 10 year treasury yield ($TNX) closed at 1.70% and is moving perilously close to major support near 1.65%. A break below that yield support would suggest treasuries are being accumulated and that would not bode well for U.S. equities.
Current Outlook:
In addition to price and moving average support on our key indices, let's also watch to see how consumer stocks perform this week and whether the XLY:XLP (discretionary vs. staples ratio) can hang onto relative support. Consumer discretionary stocks were hurt badly last week by poorly performing retail stocks and this space needs to see recovery this week. Here's the latest trend in consumer stock trading performance:
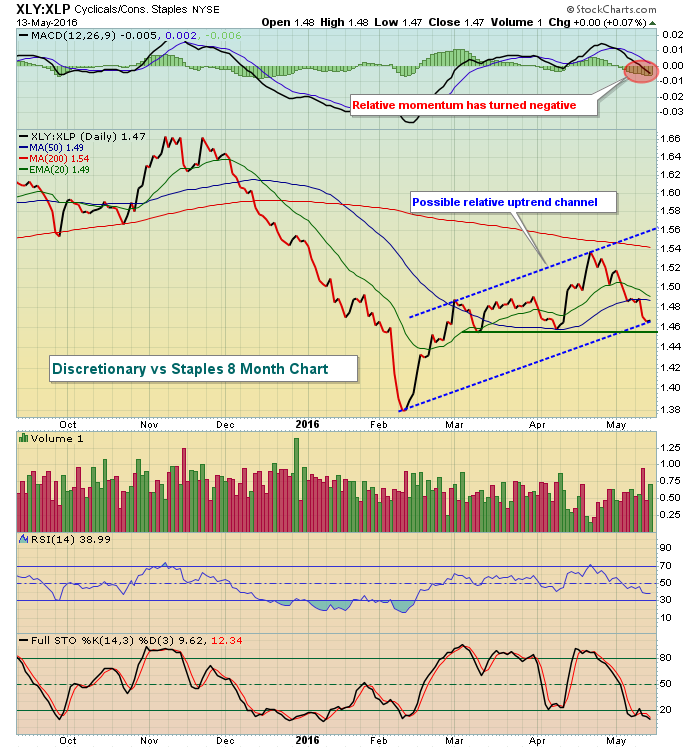 The two scenarios - both bullish and bearish - are laid out above. The bullish scenario is that the relative uptrend channel continues and we just hit a key relative low. The bearish scenario would suggest that the channel will be broken and then relative support will be broken as well. That breakdown would likely lead to further selling in our major indices. Therefore, let's keep a close eye on how the two parts of consumer stocks, discretionary and staples, trade vs. one another.
Sector/Industry Watch:
Apparel retailers ($DJUSRA) broke down last week beneath price support and are in need of a very quick reversal. You can see the significance of last week's selloff on the long-term chart below:
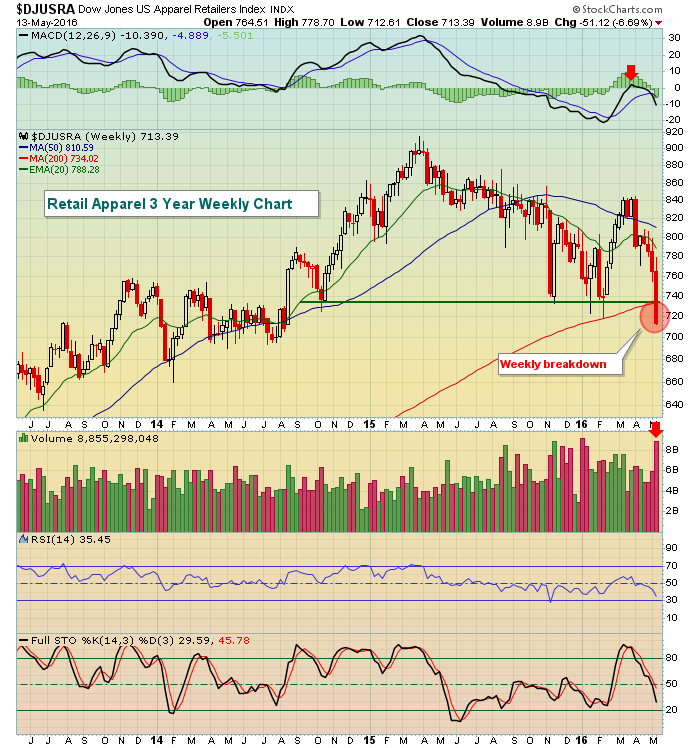 It was a brutal week with the DJUSRA tumbling 6.69% in just one week and the volume was clear as there seemed to be a mass exodus. On a bounce, the 740 price level is likely to be a difficult one for the bulls. Beyond that, the now-declining 20 week EMA would be the next target to the upside.
Historical Tendencies:
While we're focusing on the apparel retailers, let's look at the seasonal tendencies over the past 17 years:
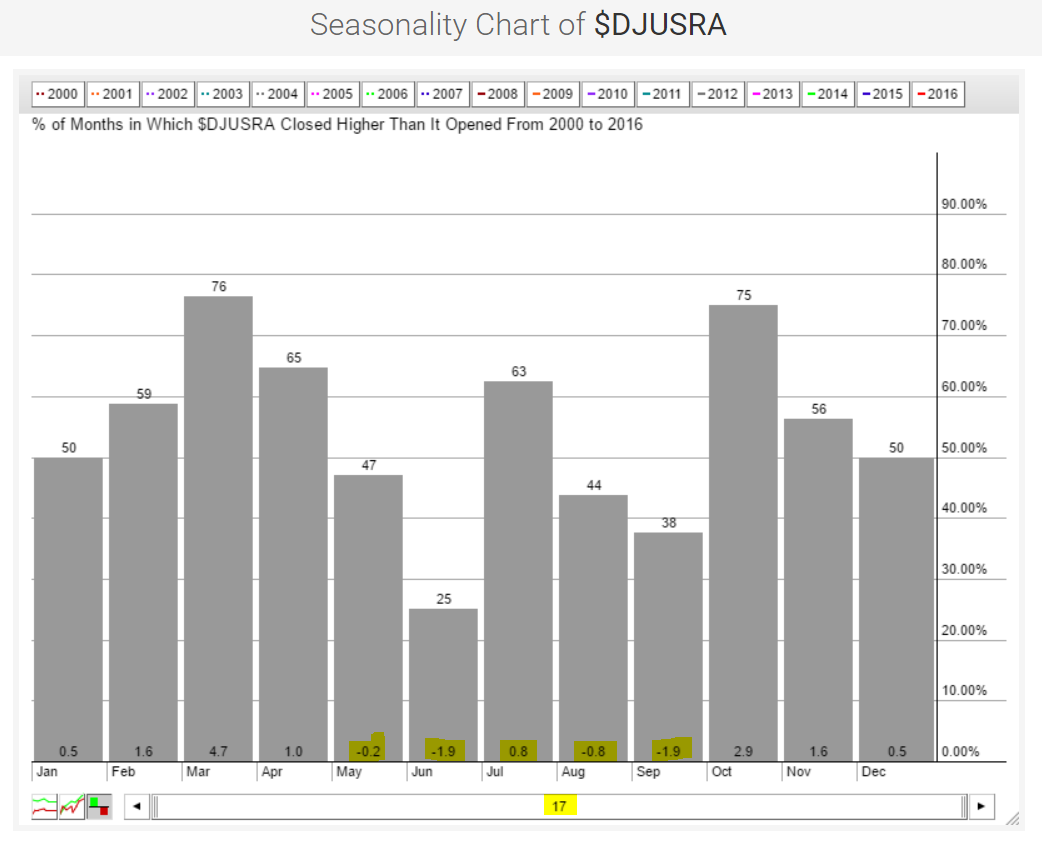 Take a look at the yellow highlighted monthly average returns this century. May through September tend to yield mostly negative results so the recent technical breakdown takes on more significance in my opinion. I'd be careful putting too much reliance on retail stocks, particularly within the apparel space, and consider using bounces to exit any exposure in the group.
Key Earnings Reports
(reports after close, estimate provided):
A: .39
Key Economic Reports
May empire state manufacturing survey released at 8:30am EST: -9.02 (actual) vs. +7.00 (estimate)
May housing market index to be released at 10:00am EST: 59 (estimate)
Happy trading!
Tom


