Market Recap for Tuesday, May 17, 2016
The wishy-washy, back and forth, yo-yo action continued on Tuesday as Monday's gains were completely erased by Tuesday's close. The culprits? Well, eight of the nine sectors finished lower after all nine rose on Monday, but the primary weakness centered around the defensive consumer staples (XLP, -1.96%) and utilities (XLU, -1.70%) sectors. That's very unusual as heavy selling normally unnerves traders to the point where they want to unload the more aggressive names. But that's what this market has been all about in 2016 - doing the unexpected. We now have a market that is not only unable to make up its mind in the short-term, but it's also been unable to decide where it wants to go in the longer-term as well. One look at the Dow Jones weekly chart and you'd think you've been at an amusement park the past year. Take a look:
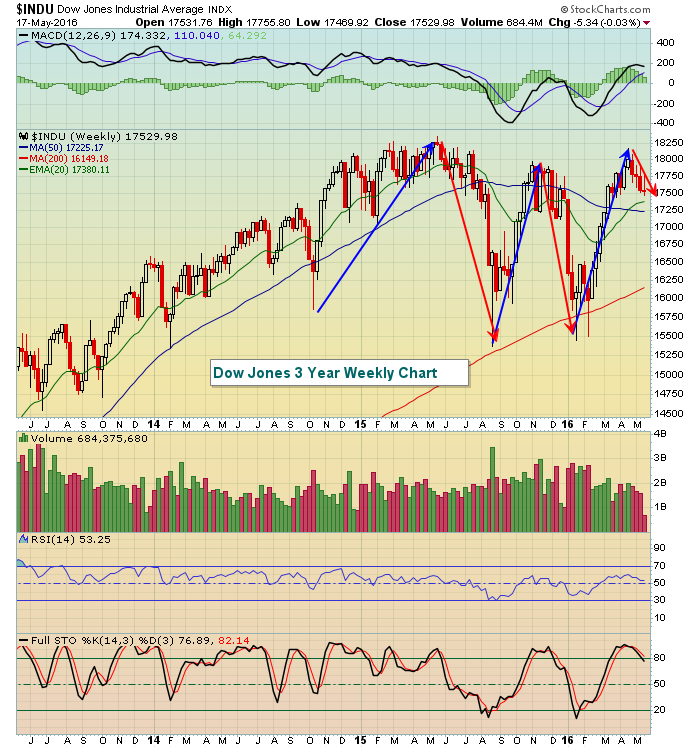 It's been a nauseating roller coaster ride for many and it appears we're heading back downhill. Hold on tight.
Uncharacteristically, two of the strongest industry groups recently led Tuesday's decline - the Dow Jones U.S. Food Products Index ($DJUSFP, -2.56%) and the Dow Jones U.S. Distillers and Vintners Index ($DJUSVN, -2.21%). They both were set up for short-term weakness. Take a look at the DJUSVN:
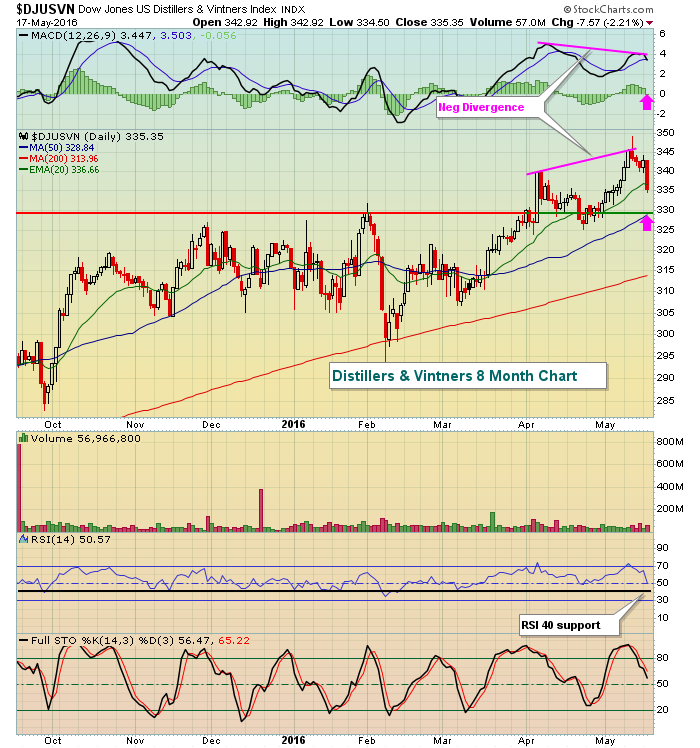 Slowing momentum (negative divergence) and overbought conditions spelled doom for the DJUSVN. The increased selling pressure on Tuesday ended in the loss of 20 day EMA support. It appears the group is likely heading for a 50 day SMA test and possibly a MACD centerline reset (pink arrows). The reward to risk at that level would be solid for long entry into the group. We might also see the RSI approach 40 where an uptrending industry group or stock typically become attractive.
The DJUSFP is featured below in the Sector/Industry Watch section.
Pre-Market Action
Global weakness is front and center as we await the FOMC minutes, to be released at 2pm EST this afternoon. Major Asian markets closed lower overnight, including a 1.45% loss in Hong Kong and a 1.28% decline in China. It was only slightly better in Europe this morning as all the major markets there are currently under water as well, albeit fractionally so.
Here in the U.S., futures have been weakening as we approach the open and they too are in the red. Given the poor finish on Tuesday, keep an eye on the 17400-17500 support area on the Dow Jones and the 2025-2050 support level on the S&P 500. A visual analysis of support appears on the NASDAQ in today's Current Outlook section below.
Target (TGT) disappointed traders this morning and the stock is under heavy selling pressure, down 7.73% in pre-market trading at last check. Wal-Mart (WMT) is set to report its earnings Thursday morning before the opening bell.
Current Outlook
Much has been written and said about the indecision and mixed market signals. Today, let's simply focus on key price support. With respect to the NASDAQ, a quick look at the hourly chart tells us mostly what we need to know:
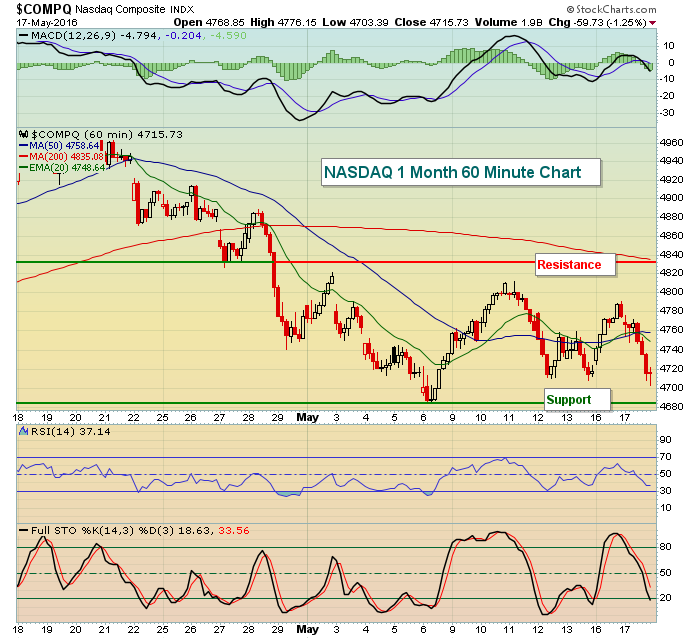 The NASDAQ is an aggressive index and has been leading the market to the downside. Yet another price breakdown would not be good for the short-term, so keep a close eye on the 4685 area. To the top side, the late April breakdown occurred near 4830 so any bounce to that level would likely be met with serious resistance.
Sector/Industry Watch
The DJUSFP was another consumer staples industry group that saw considerable weakness on Tuesday. After a recent breakout, its RSI reached 70 so a pullback was due. Check it out:
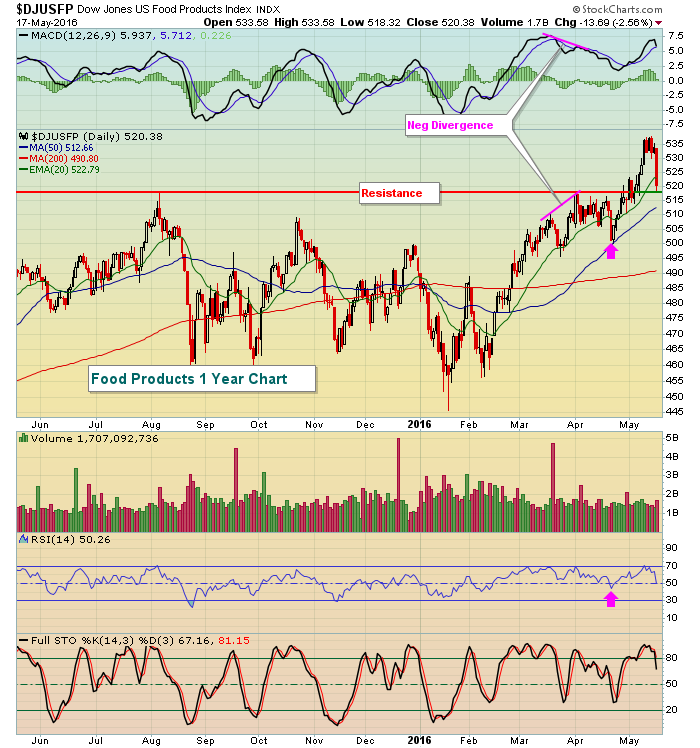 The pink arrows show the 50 day SMA test and trip back toward RSI 40 after the negative divergence printed. Since that time, however, we've seen solid action from this group until yesterday's big selloff. Kraft Heinz (KHC) had a rough day and pulled back to gap support and primarily responsible for the group's poor showing. The KHC chart remains bullish, though, so I'd expect to see the DJUSFP bounce as we test the price support level at 518. The rising 50 day SMA should also offer up support if short-term price support gives way temporarily.
Historical Tendencies
There's an interesting seasonal pattern for the DJUSFP. May tends to be a very strong month, but it's followed up by historical weakness. Check this out:
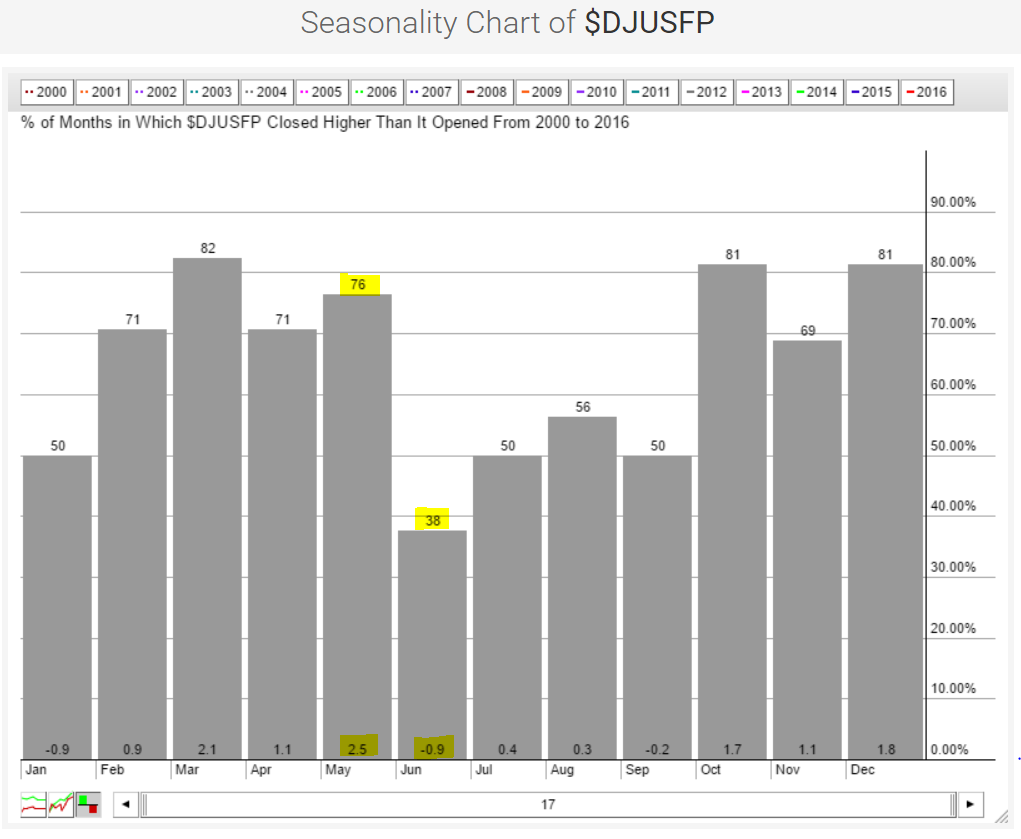 May has the best average monthly returns on the DJUSFP, but June has the worst. Based on this analysis alone, it might be the time to ring the register on names within this group upon any strength in the second half of May.
Key Earnings Reports
(actual vs. estimate):
ADI: .64 vs .62
HRL: .40 vs .38
LOW: .87 vs .85
SPLS: .17 vs .16
TGT: 1.29 vs 1.20
(reports after close, estimate provided):
CRM: .08
CSCO: .50
SNPS: .47
TTWO: .13
URBN: .25
Key Economic Reports
None, although the FOMC minutes will be released at 2pm EST this afternoon
Happy trading!
Tom


