Market Recap for Thursday, May 19, 2016
Utilities (XLU, +1.01%) and consumer staples (XLP, +0.98%), two defensive sectors, easily outdistanced all of the other sectors with respect to Thursday performance. So while the save of price support across all of our major indices was nice, keep in mind that market participants are not exactly rushing into aggressive stocks and willing to risk their capital. That has been the theme in the U.S. stock market for months and the biggest reason why it's so difficult to become aggressively long. Of course the uncertainty over U.S. elections this fall, along with the Fed monetary policy and global economic concerns, aren't helping either.
The bears had a HUGE chance to take short-term control of the action on Thursday and, quite frankly, they failed. Volatility ($VIX) was on the rise and hit 17.65 intraday, which was well above the highest close (16.26) since mid-March. But the close was just 16.33. I suppose you can argue a breakout is a breakout, but leaving that long tail to the upside on the VIX is a bit worrisome if you're shorting U.S. equities. Here's the chart:
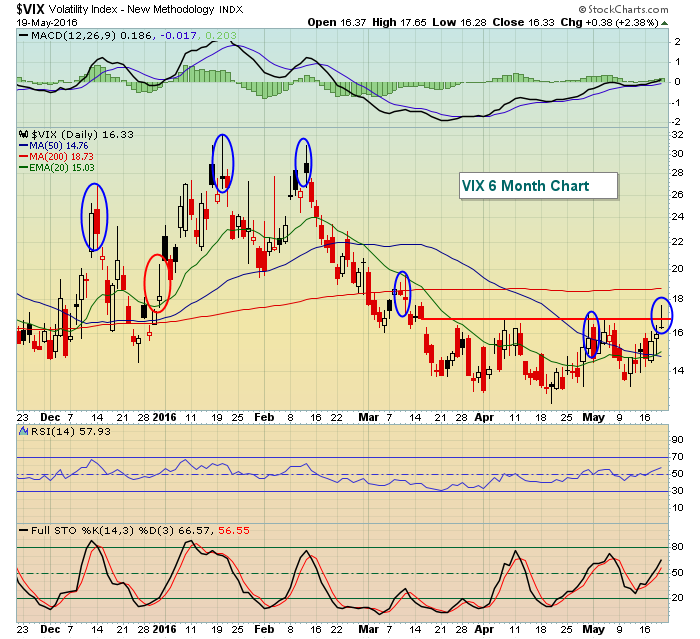 The failure to make the breakout looks fairly obvious to me. A breakout in the VIX is usually synonymous with a breakdown in the S&P 500. Intraday on Thursday, that's exactly what we saw. But it wasn't sustained into the close and that is problematic for the bears in the very near-term. The blue circles above show several instances where those long "tails" to the upside reflect a change in sentiment that led to reversals. Of course, there's an exception to everything and the red circle shows a long tail after an uptrend, but the uptrend continues. In short, there are no guarantees in the stock market. However, the reversal in the VIX on Thursday indicates a higher likelihood of lower VIX readings in the near-term and higher equity prices. We'll see.
Financials (XLF, -0.95%) and industrials (XLI, -0.94%) were the two worst performing sectors on Thursday as hotel & lodging REITs ($DJUSHL, -3.15%) added to Wednesday's losses after breaking down beneath bull flag support. Check it out:
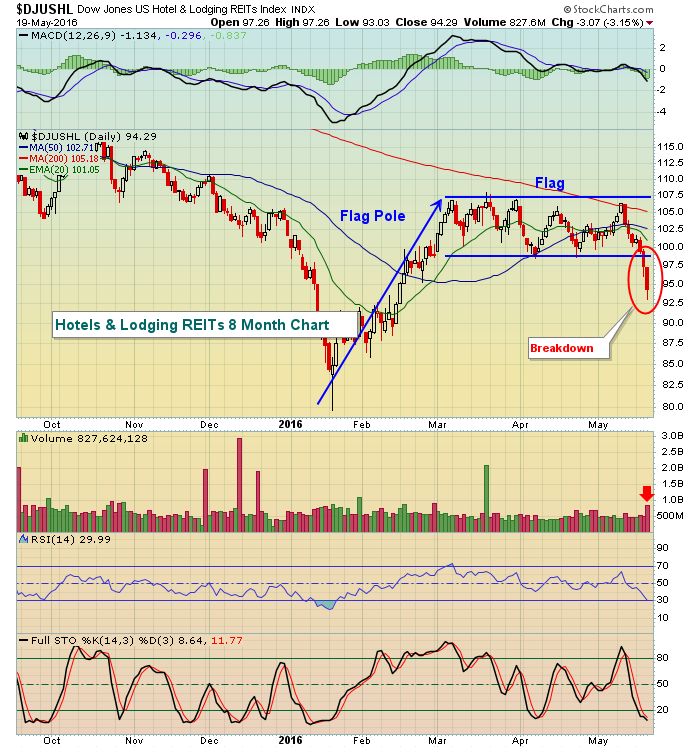 The recent rise in the 10 year treasury yield ($TNX) is undoubtedly hurting the REITs.
Pre-Market Action
U.S. futures are higher this morning, following the lead of global markets, which are mostly modestly higher. Applied Materials (AMAT) reported strong results after the closing bell on Thursday and is trading 7.5% higher in the pre-market session. That should help to boost semiconductor stocks ($DJUSSC), which have been struggling to clear 20 day EMA resistance after their recent triple top in March and April. A boost in the the DJUSSC could carry over to other areas of technology, a welcome sign for the bulls who are looking for a catalyst to jump start the market and potentially create another push to the upside to challenge 2015 highs.
The only economic news out today is existing home sales, which will be released at 10:00am EST.
Current Outlook
Well, it didn't look good for the bulls heading into the afternoon session on Thursday, but once again their resiliency was evident. The Dow Jones, S&P 500, NASDAQ and Russell 2000 all lost the short-term price support that I've been discussing of late. Yet each of them rallied in the afternoon to hold onto closing price support. While that doesn't guarantee us the worst of the selling is over (the breakout in the VIX is of concern despite the reversal and long tail that printed there), it does point to the probability of at least a short-term bounce. I'll use the NASDAQ's chart as an example of the save that was made:
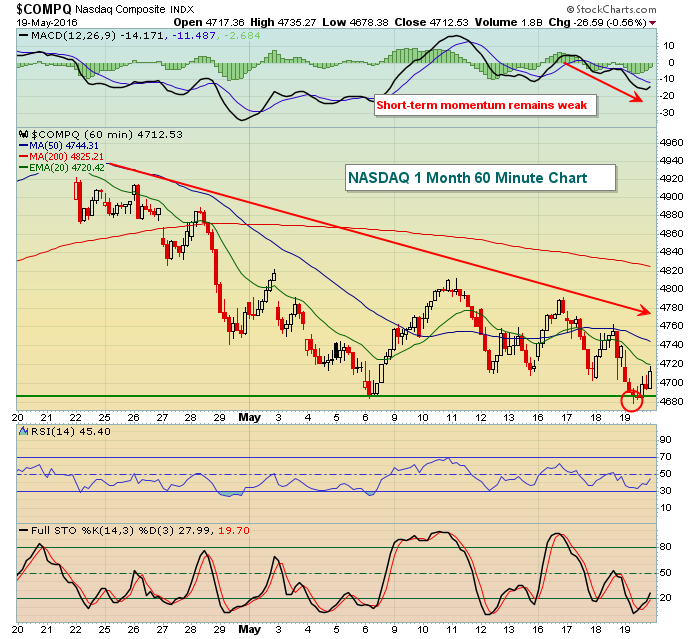 There's a clear downtrend in play in the short-term and momentum is bearish for sure. But the red circle illustrates the key reversal on Thursday just after it appeared we had a price support breakdown. For now, the bulls have avoided what ultimately may be inevitable unless money begins to rotate back toward offensive areas.
Sector/Industry Watch
Airlines ($DJUSAR) remain under pressure and could see much more selling. There are two keys to their future performance. First, will crude oil prices ($WTIC) continue to rise and break above price resistance near $50 per barrel? A breakout in crude would be bearish for airlines. Second, will technical price support hold? The DJUSAR made a major long-term breakout above the 200 level and has returned to this level on a few occasions only to hold each time. Failure to hold after several successful tests would be bearish technically and likely cause considerable distribution (selling). Take a look:
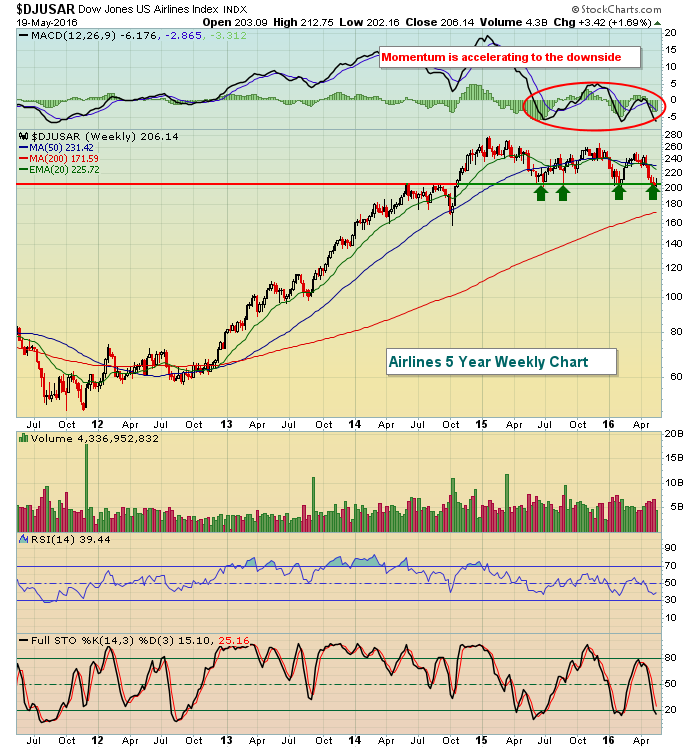 Momentum has completely flip-flopped over the past year with the weekly MACD residing mostly beneath the centerline. While that is clearly a negative, price support has been holding. Failure to hold price support, however, would be doubly bearish because of upcoming seasonal concerns. Check out the Historical Tendencies section below for details.
Historical Tendencies
We know that airlines are testing very critical price support on its long-term chart as reflected above. It's also important to note that June historically has been a very weak month for airline stocks. So keep in mind that if airlines lose their price support close to 200, they'll not only face technical sellers, but also face historical headwinds. Here's the historical calendar month performance for airlines over the past 17 years:
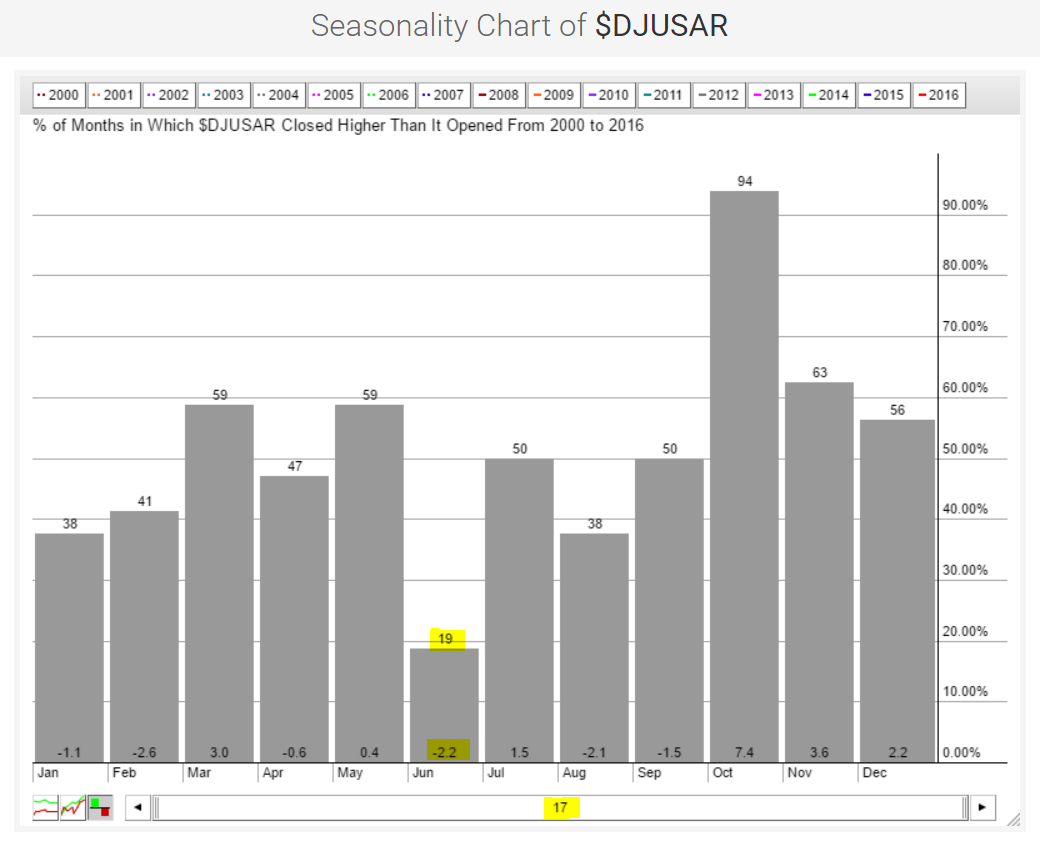 Airline stocks have risen just 19% of the time during the month of June over 17 years. That's by far the worst percentage of all calendar months. In terms of average monthly returns, only February's -2.6% is worse than June's -2.2%.
Key Earnings Reports
(actual vs. estimate):
BKE: .48 vs .54
CPB: .65 vs .65
DE: 1.56 vs 1.46
FL: 1.39 vs 1.40
Key Economic Reports
April existing home sales to be released at 10:00am EST: 5,400,000 (estimate)
Happy trading!
Tom


