Market Recap for Wednesday, May 18, 2016
It was an interesting day on Wall Street on Wednesday. Once the FOMC minutes were released at 2pm EST, traders panicked as the Fed signaled the possibility of a June interest rate hike. They said what they've been saying, that a potential rate hike would be data dependent. Still, traders interpreted it as though the Fed wants to raise rates another quarter point next month.
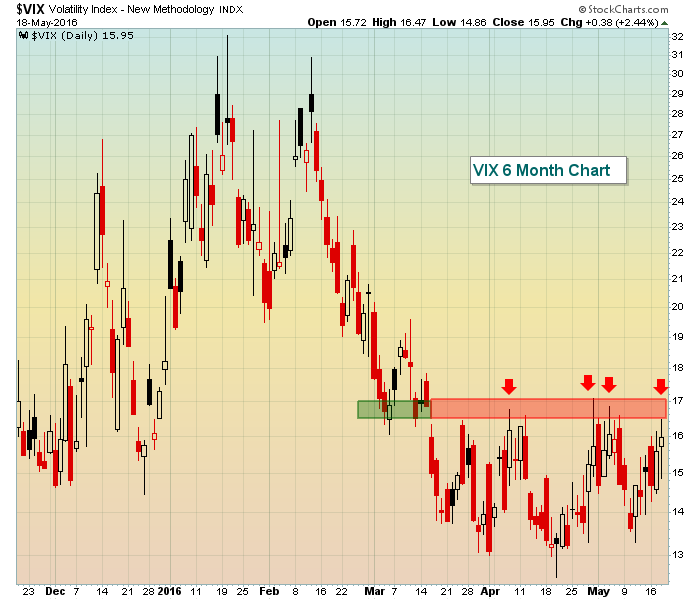
The Dow Jones fell immediately to the bottom of its recent 17400-17500 price support level and the S&P 500 tumbled into the middle of its 2025-2050 support zone. The NASDAQ was on the verge of another move beneath 4700 and the Russell 2000 approached recent lows near 1095. Meanwhile, the Volatility Index ($VIX) rose to a high of 16.75 as fear began to mount. After the VIX traded above this level for all of the first two and a half months of 2016, it had not closed above 16.26 since March 16th. A rising VIX is usually associated with a possible steep selloff in equities so the resistance of 16.26 since March 16th is a big deal. Wednesday's intraday high of 16.75 had the bulls on their collective heels just as key short-term price support was being tested across all of our major indices.
The good news? The stock market rallied in the final 30 minutes, once again staving off a bear attack and breakdown. Take a look at the latest on the VIX:
 The anticipation of potentially higher rates sent financial shares straight to the top of the sector leaderboard. Banks ($DJUSBK) were big beneficiaries, turning higher right on cue in the middle of a key short-term support zone. Check them out:
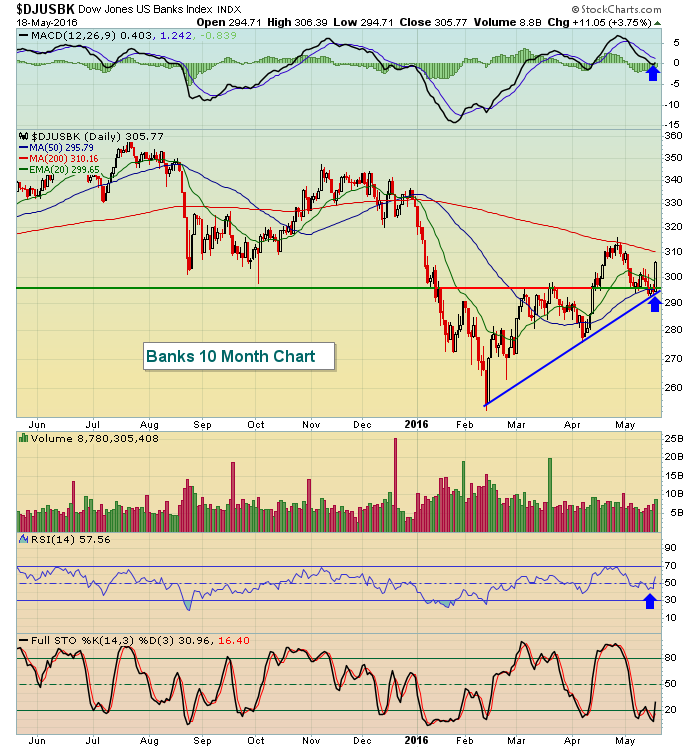 While the longer-term remains a bit dicey for banks, the short-term bullishness was at least a temporary reprieve. The blue arrows show that the DJUSBK bounced just as the MACD touched centerline support, price hit both price and trendline support and RSI neared 40. The bank bulls are breathing a little easier this morning.
Utilities (XLU, -1.87%) typically struggle with the threat of rising interest rates and Wednesday was no exception as the XLU was easily the worst performing sector ETF.
Pre-Market Action
Wal-Mart (WMT) reported solid quarterly earnings results this morning and it came at a critical time. Target (TGT) disappointed yesterday with its quarterly results and gapped down to challenge significant support, but then printed a short-term bullish hammer. Check out the TGT action on Wednesday:
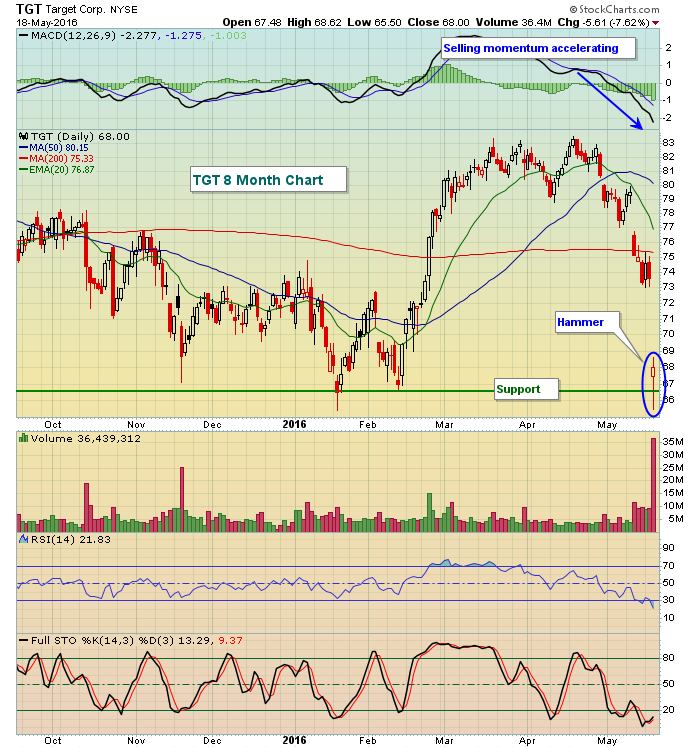 The volume was off-the-charts heavy and there was a significant price breakdown intraday, but the reversal suggests perhaps we'll see some relief from the relentless selling since the top in mid-April. WMT's results should help with that relief as their results suggest some of this crazy selling in retail stocks may have been overdone.
The 10 year treasury yield ($TNX) is relatively flat this morning after a huge 12 basis point rise on Wednesday from 1.76% to 1.88%. Apparently, the treasury market believes the Fed when they say they may rate interest rates again in June.
Overnight and this morning, we're again seeing global weakness with the German DAX ($DAX) not far from losing key gap support close to 9750. In addition to economic concerns, the airliner crash off the coast of Egypt is adding to this morning's weakness.
Current Outlook
The Dow Jones made yet another key save in the final 30 minutes of trading on Wednesday. We're a week away from entering a very bullish historical period for the U.S. stock market. If we can make it through the next 3-4 trading sessions unscathed, the historical skies will turn much brighter, as discussed below in the Historical Tendencies section. Technically, however, the short-term support zone on the Dow Jones is clearly drawn. Take a look:
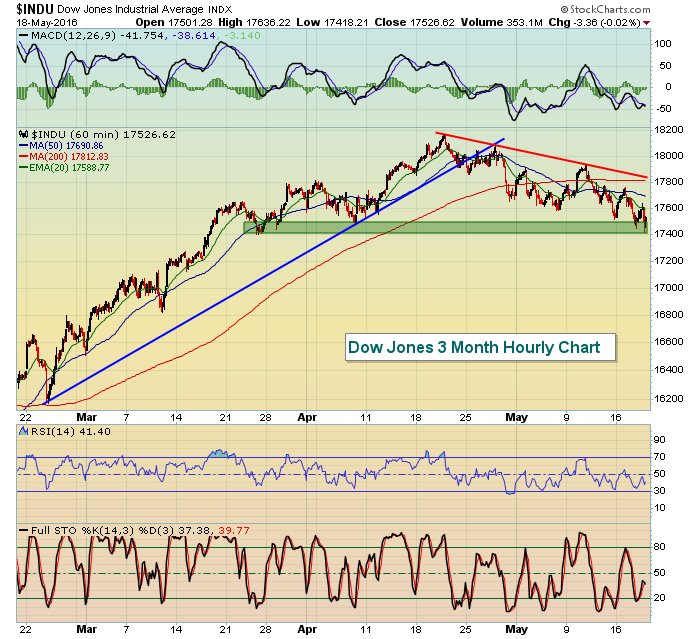 Since the end of March, the bulls have held serve between 17400-17500 on at least five occasions and need to continue to do so.
Sector/Industry Watch
Should the consolidation in the stock market eventually result in a breakout, one industry group within technology is poised to profit significantly. The Dow Jones U.S. Electrical Components & Equipment Index ($DJUSEC) is potentially in the process of forming the inverse right shoulder of a bullish inverse head & shoulder continuation pattern. Check this out:
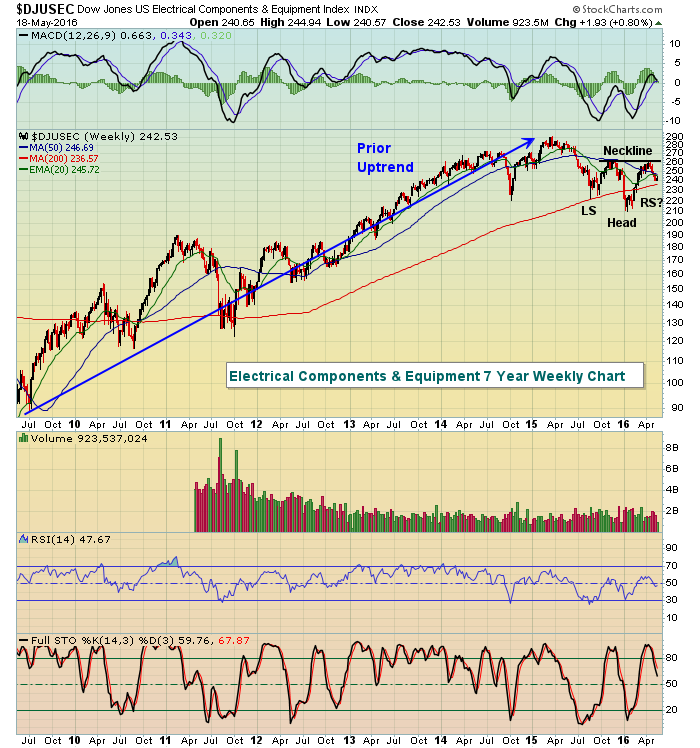 Continuation patterns require a prior trend. I think the bull market rally since 2009 certainly qualifies as an uptrend. Generally, continuation patterns break in the direction of the prior trend, which clearly was higher here.
Historical Tendencies
From May 19th through May 25th, the S&P 500 (since 1950) shows negative annualized returns for every day within this period except May 22nd (falls on Sunday this year). However, if the bulls can hold off the bears for a week, a very bullish historical period follows. Here are the annualized returns for each day from May 26th through June 6th on the S&P 500:
May 26th (Thursday): +32.37%
May 27th (Friday): +35.56%
May 31st (Tuesday): +55.50%
June 1st (Wednesday): +48.27%
June 2nd (Thursday): +14.68%
June 3rd (Friday): +10.54%
June 6th (Monday): +51.78%
Key Earnings Reports
(actual vs. estimate):
AAP: 2.51 vs 2.61
DKS: .50 vs .49
WMT: .98 vs .88
(reports after close, estimate provided):
ADSK: (.26)
AMAT: .32
GPS: .32
ROST: .73
Key Economic Reports
Initial jobless claims released at 8:30am EST: 278,000 (actual) vs. 275,000 (estimate)
May Philadelphia Fed business outlook survey released at 8:30am EST: -1.8 (actual) vs. +3.0 (estimate)
April leading indicators to be released at 10:00am EST: +0.4% (estimate)
Happy trading!
Tom


