Market Recap for Wednesday, May 25, 2016
Energy (XLE, +1.58%), materials (XLB, +1.23%) and financials (XLF, +1.06%) were the three sectors that gained more than 1% on Wednesday as the U.S. stock market rally extended to almost a week. The S&P 500 climbed to within 12 points of its recent high and is only 2% or so away from testing its all-time high close of 2131. This comes despite all the uncertainty over the upcoming presidential election this fall and the uncertainty over whether the Fed will raise rates when they meet in June. The S&P 500 has reset its MACD at the zero line and is now just beginning to turn higher. Check out the negative divergence in April and the subsequent consolidation to unwind those momentum issues:
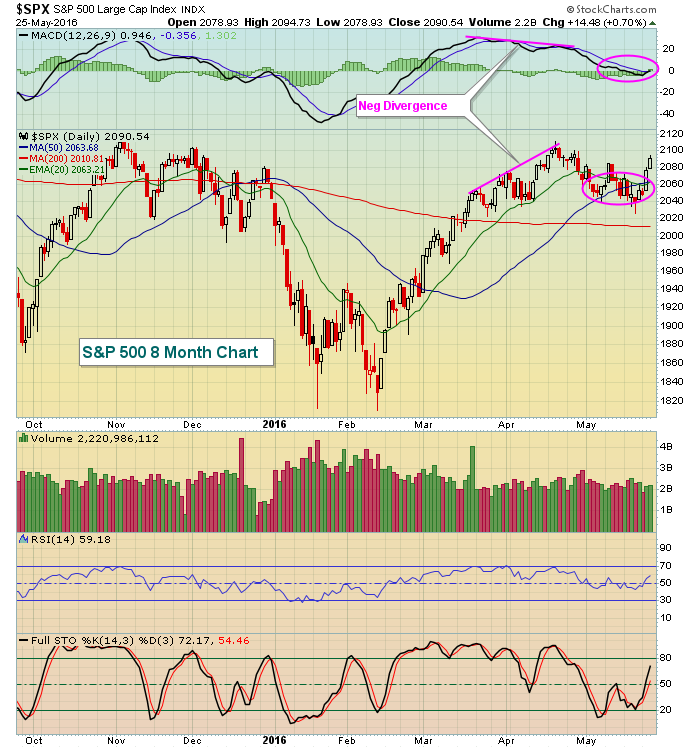 The pink circles highlight exactly what I look for after a negative divergence emerges.
Banks had a very strong day to break out above recent highs after holding price support. Check out their current technical view in the Sector/Industry Watch section below.
Pre-Market Action
U.S. futures are slightly higher as crude oil ($WTIC) topped $50 per barrel this morning. Overnight, key Asian markets finished fractionally higher, while in Europe we see mixed action today. Yesterday, the German DAX ($DAX) managed to break to the upside of its May trading range and is adding a bit more this morning.
Tons of retail quarterly earnings reports are out in pre-market action and the results are mixed. The second estimate of Q1 GDP will be released Friday morning at 8:30am EST and could provide a market-moving reaction.
Current Outlook
While the intermediate-term is looking stronger and we generally experience historical tailwinds from May 25th to June 6th, we need to be mindful of short-term overbought conditions. For that, I normally look at 60 minute charts. Here's the latest short-term view of the S&P 500:
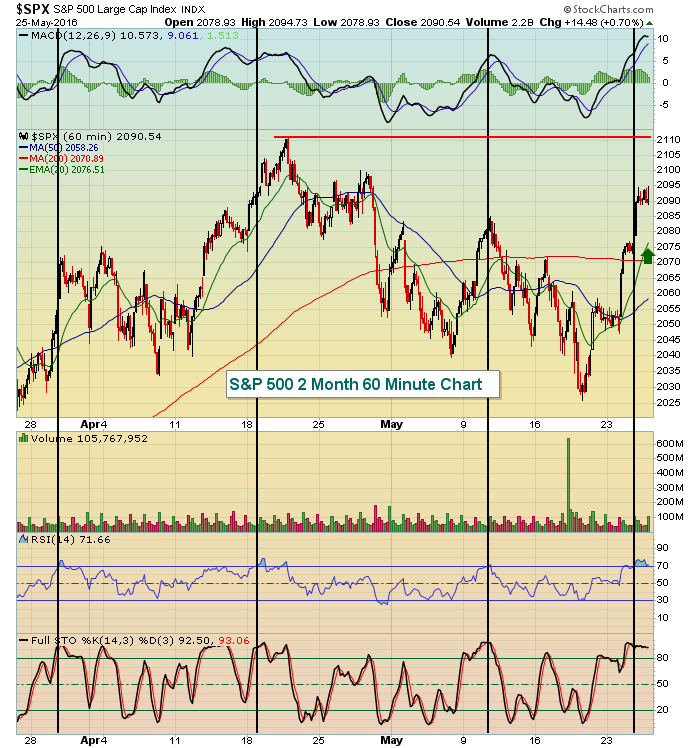 The black vertical lines mark the times when the S&P 500's RSI and stochastic both move into overbought territory at 70 and 90, respectively. Note that each time we're either at or very near a short-term top. Overbought can remain overbought for a period of time, but in the sideways consolidating market that we've been in, I'd look for the S&P 500 to take a break soon, especially if the 2102 (closing resistance) and 2110 (intraday resistance) levels are reached. The green arrow marks the rising 20 hour EMA, where I'd expect to see buyers return on any bouts of selling.
Sector/Industry Watch
Banks ($DJUSBK, +1.90%) are very important to a continuing bull market and they're looking better and better. After clearing 290-300 resistance, the latest bout of selling held in that zone before recent strength forced another breakout. Take a look:
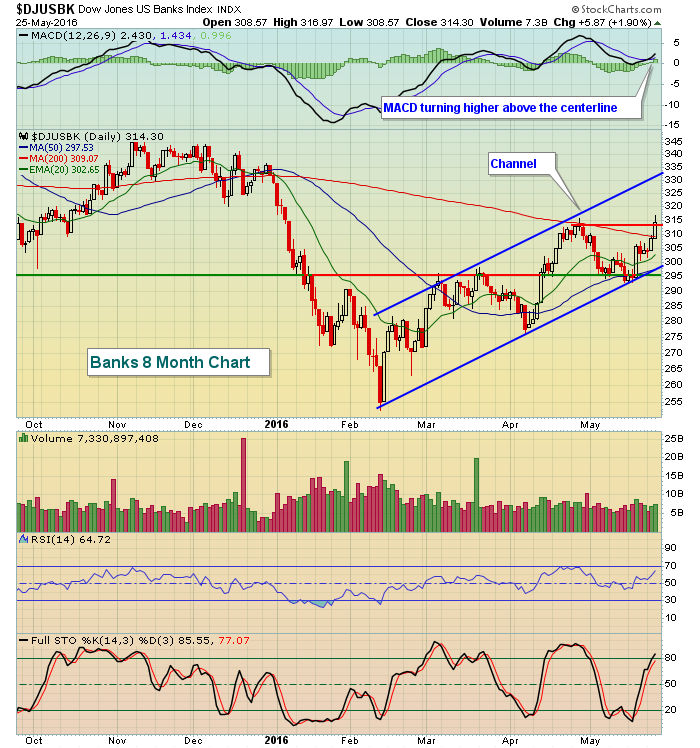 The close on Wednesday cleared the late April high and banks now appear poised to challenge the upper end of their channel.
Historical Tendencies
While banks have improved technically, they face their most challenging calendar month when June arrives. Check out the seasonality of banks:
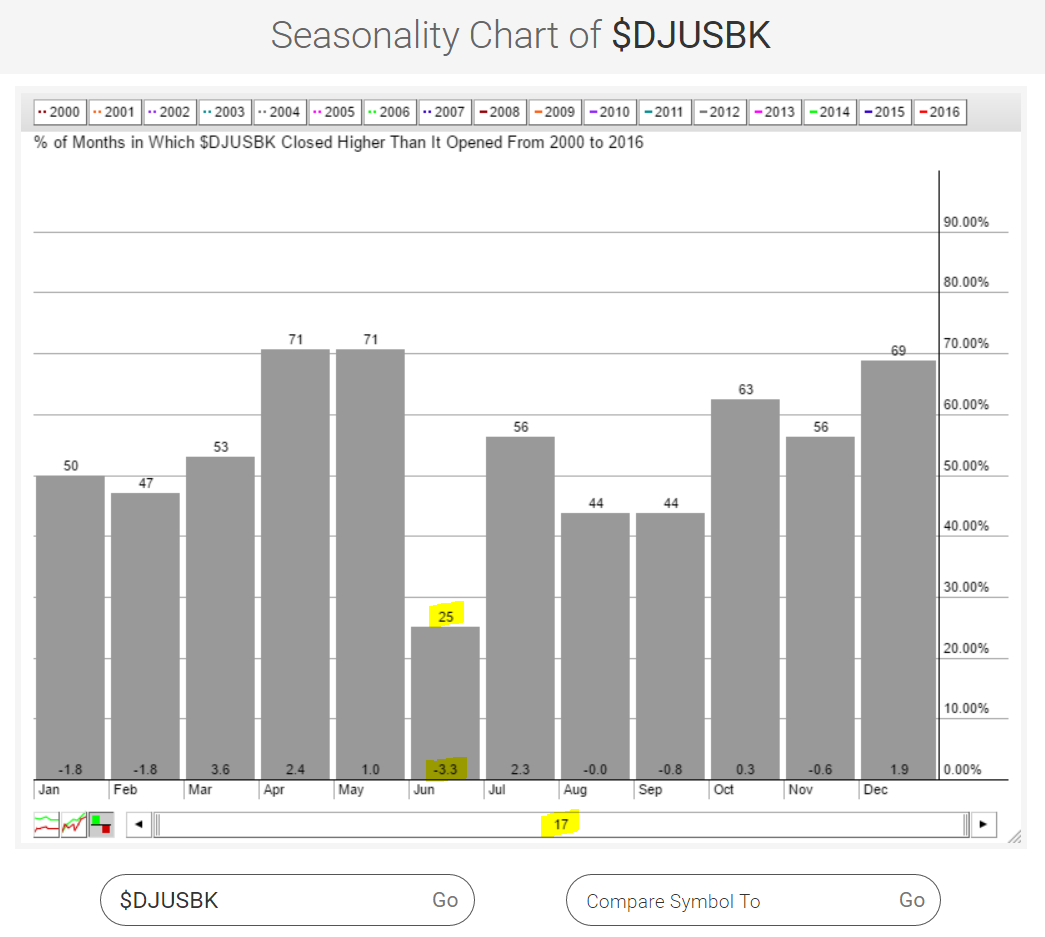 Over the last 17 years, June is easily the worst calendar month in terms of average monthly returns. And the fact that banks have only risen 25% of Junes over the past 17 years is not a great sign. But 25% is better than 0% so perhaps the technical indications will win out this year. I'm looking for continuing strength in banks into early June. Then we'll watch to see if a negative divergence or severe overbought conditions emerge.
Key Earnings Reports
(actual vs. estimate):
ANF: (.59) vs (.50)
CHS: .25 vs .31
DG: 1.03 vs .94
DLTR: .89 vs .80
IGT: .57 vs .43
PDCO: .77 vs .76
RY: 1.21 vs 1.20
TD: .90 vs .87
(reports after close, estimate provided):
GME: .61
ULTA: 1.29
Key Economic Reports
April durable goods released at 8:30am EST: +3.4% (actual) vs. +0.3% (estimate)
April durable goods ex-transports released at 8:30am EST: +0.4% (actual) vs. +0.4% (estimate)
Initial jobless claims released at 8:30am EST: 268,000 (actual) vs. 275,000 (estimate)
April pending home sales to be released at 10:00am EST: +0.8% (estimate)
Happy trading!
Tom


