Market Recap for Thursday, May 26, 2016
Utilities (XLU, +1.13%) and consumer staples (XLP, +0.40%) are two defensive groups and they led the market action on Thursday. I'd be more concerned if these two groups led a significant breakout. But given that three of our four major indices were lower on Thursday, I'm not overly upset at the sector performance. In fact, despite the afternoon weakness, both technology (XLK, +0.32%) and consumer discretionary (XLY, +0.20%) finished in positive territory so the sector performance wasn't horrible.
The XLY:XLP relative ratio has been strengthening to support the latest S&P 500 and we want to see this continue, especially if the S&P 500 breaks into all-time high territory. Here's the latest relative view:
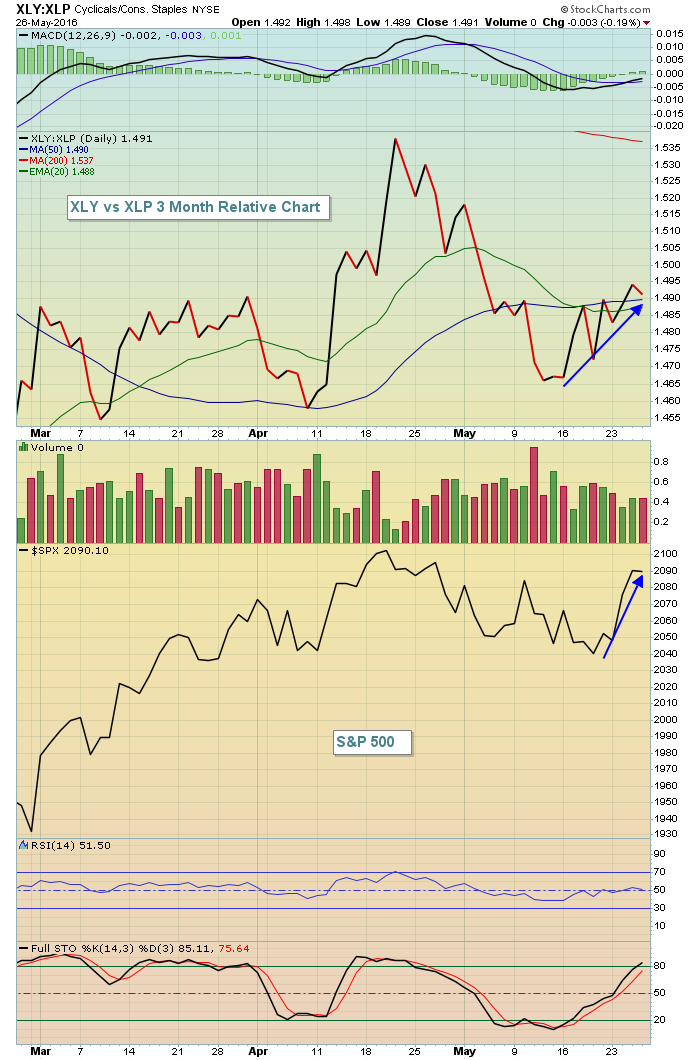 There's still much work to be done on this relative chart, but given all the recent poor headlines from retail, it's somewhat amazing that this relative ratio isn't much weaker.
Materials (XLB, -1.07%) were under pressure on Thursday even though the U.S. Dollar index ($USD) took a second day off from its recent rally. A drop in the USD beneath its now rising 20 day EMA could fuel more buying in the XLB, especially gold. But I'd expect to see that 20 day EMA hold as support on further weakness.
Pre-Market Action
The revised Q1 GDP came in slightly weaker than expected this morning, +0.8% vs +0.9%, but U.S. futures have taken that slight downward revision in stride as Dow Jones futures are up 11 points at last check. The flat open and perhaps hesitation on any intraday rise might be expected given upcoming price resistance and the potential emergence of 60 minute negative divergences to match the one that appeared yesterday on the NASDAQ. See the Current Outlook section below for a visual of the NASDAQ's 60 minute negative divergence.
Current Outlook
Yesterday, in this same Current Outlook section, I used the S&P 500's 60 minute chart to illustrate how you can use short-term overbought conditions to your advantage as a short-term trader. Today, we'll use the NASDAQ's 60 minute chart to highlight the slowing upside momentum that appears to be taking shape:
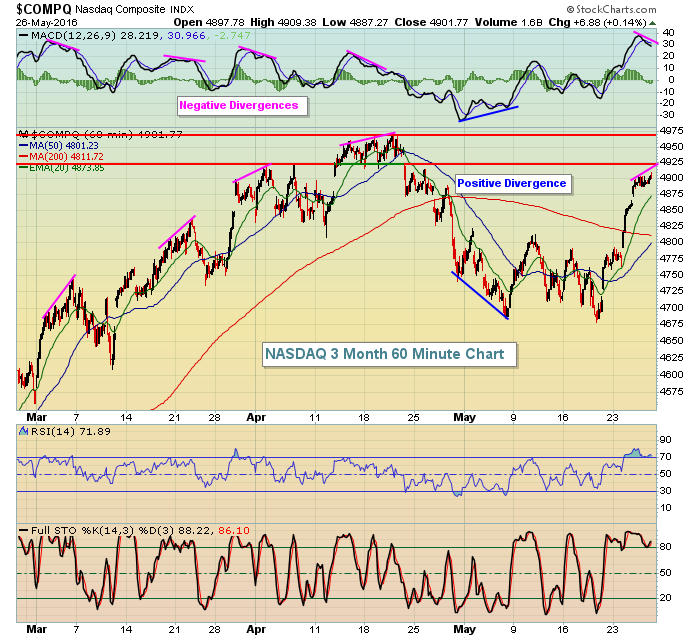 The pink lines show rising prices and declining MACDs, indicative of slowing upside momentum. In each case, the NASDAQ topped at that level, or shortly thereafter. The low in the early part of May shows the only 60 minute positive divergence that's printed over the past three months and that marked a bottom.
Currently, the NASDAQ is the only major index that shows a negative divergence on its 60 minute chart. However, the next high on the Dow Jones, S&P 500 and Russell 2000 will likely print negative divergences as well. Therefore, as the NASDAQ approaches the two price resistance levels (horizontal lines), look for a reversing candle to perhaps mark a short-term top. 60 minute negative divergences usually play out over 1-3 days of weakness - or sideways consolidation.
Sector/Industry Watch
The Dow Jones U.S. Internet Index ($DJUSNS) has attempted to cross above 1100 close to ten times since last November without a single success. A breakout above this key level would not just be bullish for this group, but it would also send a clear message to the broader market that traders are in a more aggressive mood, usually very good news for future stock market performance. Here's the latest on the internet stocks:
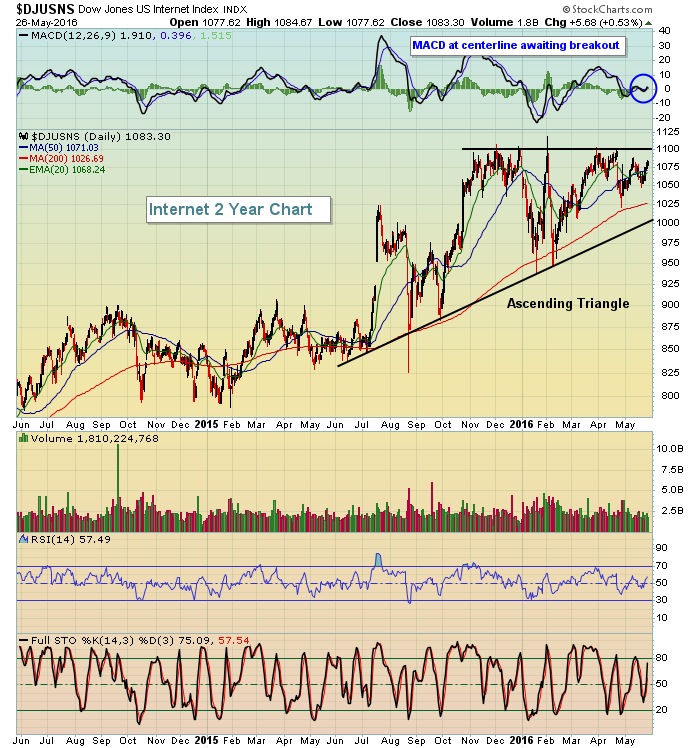 On a high volume breakout, this ascending triangle pattern would measure to the 1250-1275 area.
Historical Tendencies
While June can be a weak month for many areas of the market, the DJUSNS has performed fairly well in June over the past 16 years as reflected below:
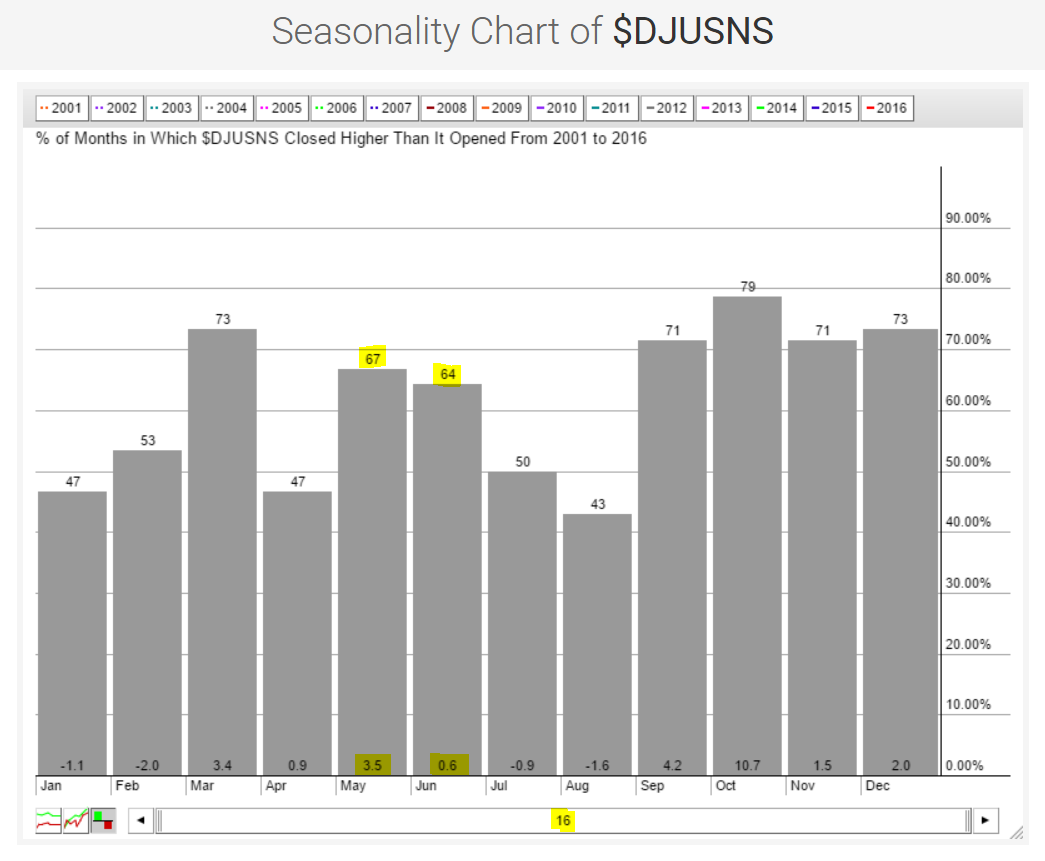 Clearly, the last four months of the year are the best consecutive months for internet stocks, but June wraps up a nice four month stretch from March through June.
Key Earnings Reports
(actual vs. estimate):
BIG: .82 vs .71
Key Economic Reports
Q1 GDP (2nd estimate) released at 8:30am EST: +0.8% (actual) vs. +0.9% (estimate)
May consumer sentiment to be released at 10:00am EST: 95.5 (estimate)
Happy trading!
Tom


