Market Recap for Tuesday, May 24, 2016
Tuesday was one of the best days of 2016. Technically, the jump in our major indices was large with the Russell 2000 and NASDAQ leading the charge with gains of 2.15% and 2.00%, respectively. Our four aggressive sectors performed extremely well as money rotated into aggressive areas of the market, a bullish sign as it occurred with our major indices all clearing key moving averages in the process. Technology (XLK, +1.88%), financials (XLF, +1.51%), consumer discretionary (XLY, +1.20%) and industrials (XLI, +1.04%) all finished in the top five among sectors, with healthcare (XLV, +1.44%) the other leading sector. Within healthcare, biotechnology stocks ($DJUSBT, +2.51%) are the most aggressive industry group and they performed exceptionally well.
Specialty finance ($DJUSSP, +3.05%) surged to its highest level since August and appears to have broken out of a very bullish inverse head & shoulders pattern. Here's the longer-term look:
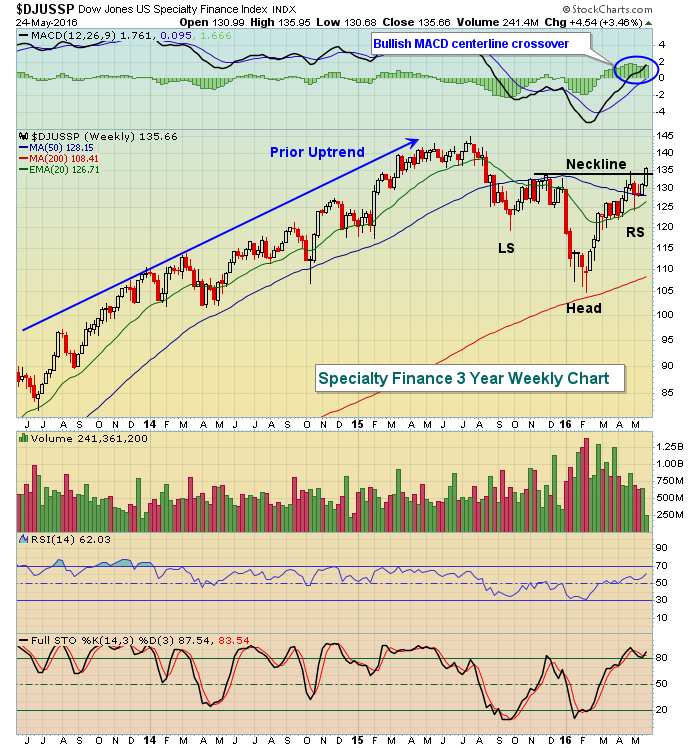 The one problem with this chart is that the candlesticks are "weekly" and it's only Wednesday. That means that this week's candle is not complete. A reversal by Friday's close could leave a "tail" well above neckline resistance with a close beneath it and that could represent trouble. Thus far, this candle is very bullish but we need to keep in mind that the strength needs to hold into Friday's close to confirm the breakout and pattern.
The dollar ($USD) continued its May rally, closing at a two month high and that likely kept pressure on energy (XLE, +0.50%) and basic materials (XLB, +0.66%). Gold mining shares ($DJUSPM, -5.67%) tumbled, offsetting strength in other areas of materials like aluminum ($DJUSAL, +1.51%) and paper ($DJUSPP, +1.50%).
Pre-Market Action
U.S. futures look to extend Tuesday's gains with the Dow Jones futures up 73 points at last check. Overnight, China's Shanghai Composite ($SSEC, -0.23%) fell, but other Asian markets rose strongly with Hong Kong's Hang Seng ($HSI, +2.71%) surging back above its declining 20 day EMA. Tokyo's Nikkei ($NIKK, +1.57%) managed to close above both its 20 day EMA and 50 day SMA.
The 10 year treasury yield ($TNX) is resuming its climb off the May 13th low of 1.70%. This morning, the TNX was up to 1.87% as it marches toward a major showdown at the 1.90%-2.00% resistance. A rising TNX means money is rotating away from the defensive treasuries, a bullish development for equities. Therefore, keep a very close eye on 2.00%.
Current Outlook
Tuesday's explosion to the upside occurred on increasing volume and cleared key moving averages. Leadership was felt in technology, specifically consumer electronics ($DJUSCE, +3.54%), software ($DJUSSW, +2.56%) and semiconductors ($DJUSSC, +2.54%). The latter was significant in that the DJUSSC closed at its highest level in 2016. Take a look at the chart:
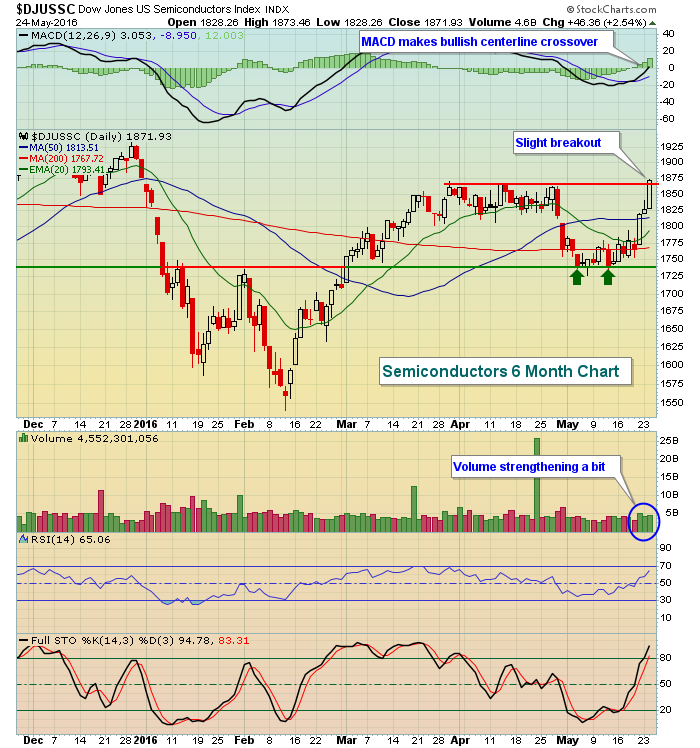 When semiconductors are on the rise, that's normally a very good sign for equities in general, especially the tech-driven NASDAQ. Keep an eye on the now-rising 20 day EMA. That's where support should be found if this breakout represents the beginning of a new trend.
Sector/Industry Watch
Business support services ($DJUSIV, +2.36%) had another outstanding day on Tuesday and continues to trade in "blue sky" territory, or all-time highs. One of the stocks leading the charge is Tyco Intl (TYC), which gained 2.82% yesterday and sports a SCTR of 97.5. The TYC chart is interesting because it illustrates a couple examples of how to trade gaps. The initial gap in January was on MASSIVE volume and had a hollow candle the day of the gap, a sign of heavy accumulation. Generally, that type of gap and follow through creates tremendous support at the open that day. The second gap in April was more subtle in terms of volume, although it did increase. Note that support was found at price support and the bottom of gap support in that example. Here's the visual:
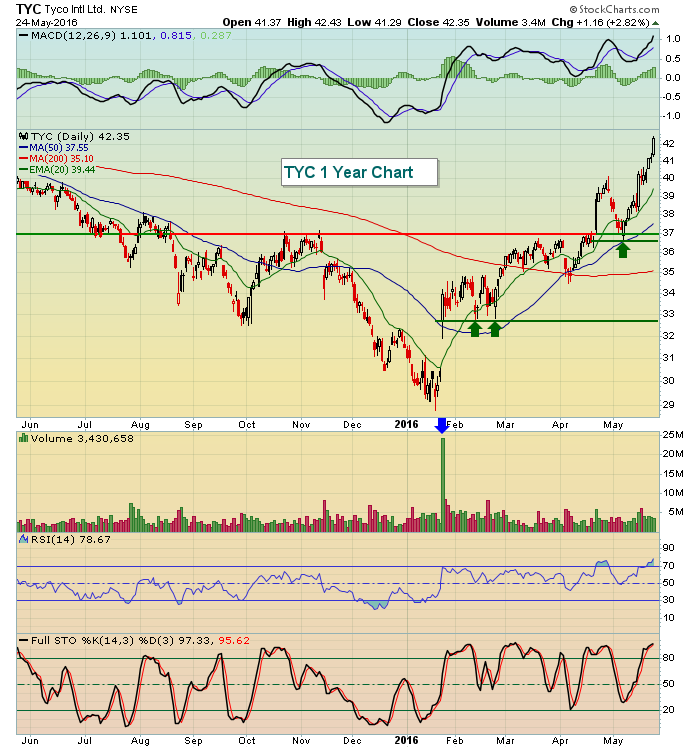 The top of gap support in the first example was important because the heavy volume occurred to drive prices up after the opening gap. It's not unusual to see these types of gaps fail to fill back to the prior close. The second gap did fill, however.
Historical Tendencies
While we're all aware of the "Go Away in May" theory, the Russell 2000 ($RUT) actually tends to perform quite well in May with an annualized return of +15.39% since 1987. May 2016 was looking to be a rough month until the surge in the RUT the past few trading sessions. A strong finish to May would likely result in another positive small cap return for the month of May.
Key Earnings Reports
(actual vs. estimate):
BMO: 1.31 vs 1.29
TIF: .64 vs .68
(reports after close, estimate provided):
COST: 1.22
HPQ: .39
NTAP: 40
PVH: 1.43
Key Economic Reports
March FHFA house price index to be released at 9:00am EST: +0.5% (estimate)
Happy trading!
Tom


