Market Recap for May 9, 2016
Biotechnology stocks ($DJUSBT) gained more than 2% on Monday, leading the healthcare sector (XLV, +1.14%) to the top of the sector leaderboard, doubling the one day return of the next best sector, utilities (XLU, +0.57%). While Monday's strength was a positive for the DJUSBT, it remains one of the weakest industry groups as you can see below:
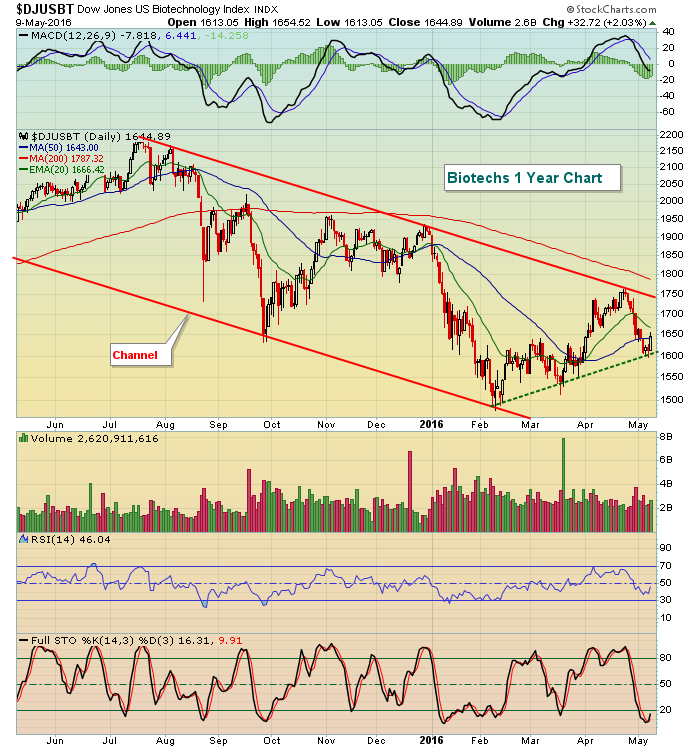 Most of April was strong for biotechnology, but the past couple weeks we've seen the group roll over again. Given that the longer-term down channel remains intact, it's quite possible this group revisits those lows from February. Short-term, watch the uptrend that connects the February, March and May lows. If that breaks, the odds of a deeper decline grows considerably.
Energy (XLE, -1.46%) was the worst performing sector as its "feast or famine" style of trading continues. Short-term, it was bearish to see 64.50-65.00 support lost. However, bulls will point to the much stronger long-term weekly chart as evidence that the tide has turned. Have a look:
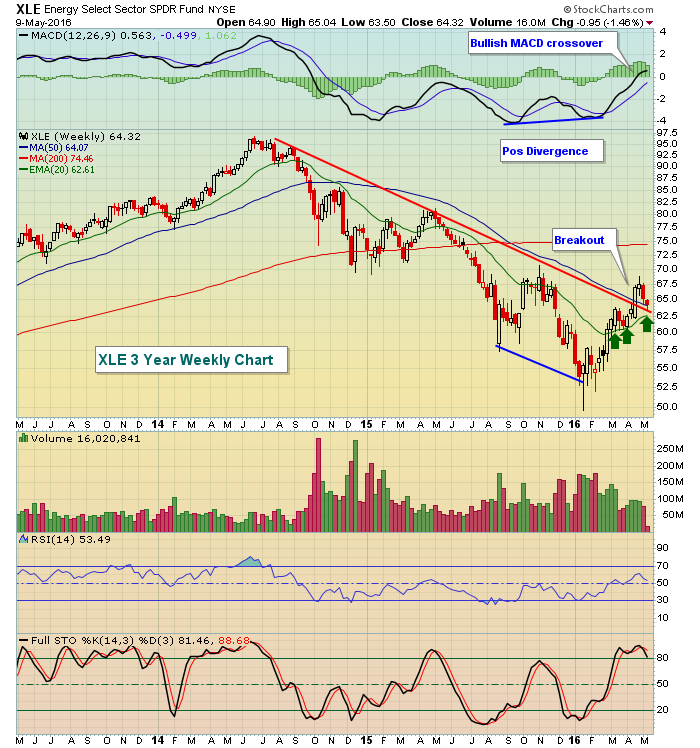 Long-term selling momentum slowed, as evidenced by the positive divergence that emerged. Since then, the XLE has been trending higher and saw a bullish MACD crossover during April's strength. The 20 week EMA is now rising and has been offering support (green arrows) on pullbacks. I'd look for that to continue.
Pre-Market Action
The biggest earnings news today will come from Walt Disney (DIS), which reports after the closing bell today. U.S. futures are tracking higher this morning, although they're well off their earlier highs. Europe is trading higher this morning as the German DAX ($DAX) moves back above 10000 to challenge its 20 day EMA at 10027. At last check, the DAX was at 10025. Asian markets were also higher overnight.
Current Outlook
There are a few industry groups that appear solid technically and look for further gains. Recently, I provided a chart of the Dow Jones U.S. Internet Index ($DJUSNS), which remains in a bullish ascending triangle pattern, so I won't repeat the chart again here. A break above 1100 would be very bullish, however. Next up is the Dow Jones U.S. Medical Equipment Index ($DJUSMS). Take a look at the current technical view:
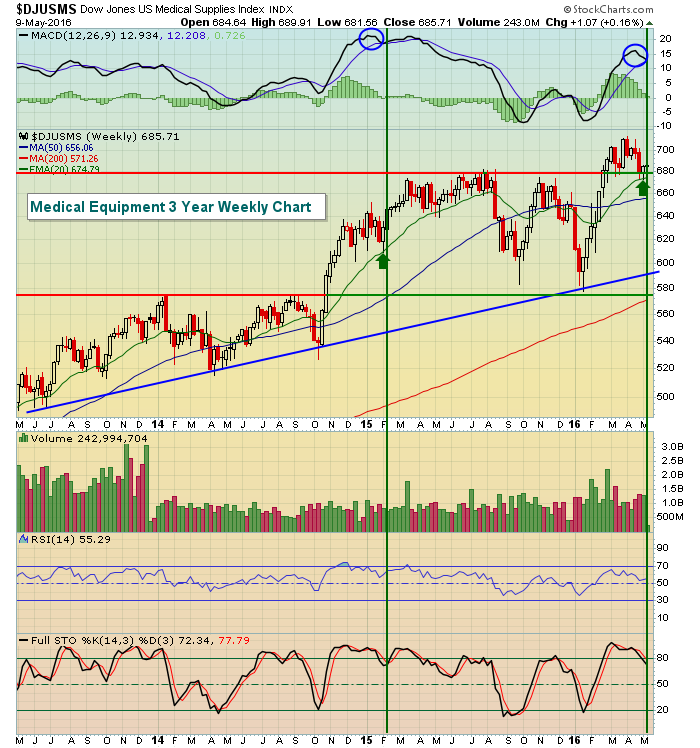 The selling over the past few weeks is setting up the DJUSMS very similar to its setup in February 2015. Shortly after breaking out, it pulled back to test its rising 20 week EMA. This time, there's solid price support near 680 as well. I'd look for another breakout in the DJUSMS in the not-too-distant future.
In the consumer discretionary space (XLY), the Dow Jones U.S. Home Improvement Retailers Index ($DJUSHI) is on the verge of a breakout to an all-time high. Check it out:
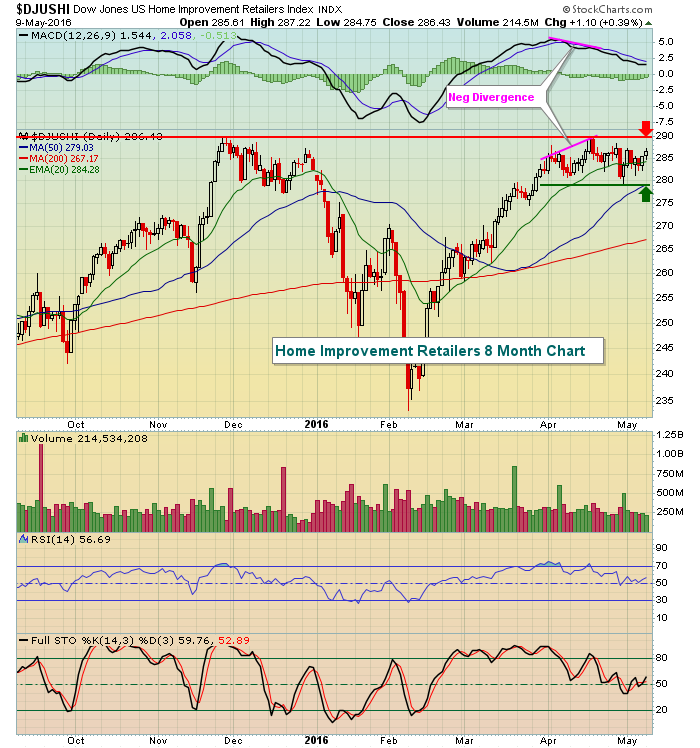 The DJUSHI is now trapped in a very narrow trading range between both price and 50 day SMA support at 279 and all-time high price resistance near 290. The negative divergence that printed in mid-April thwarted the bulls' attempt to break out, but once this period of consolidation ends, I'd look for a solid breakout into blue sky territory.
Sector/Industry Watch
The Dow Jones U.S. Trucking Index ($DJUSTK) broke down in the short-term, but has now recovered to challenge overhead resistance in the form of both its 20 day EMA and 50 day SMA. Clearing that would set the group up for a possible test of price resistance at 565. A reversing candle, however, at resistance could set the group up for continuation of its recent downtrend. Take a look:
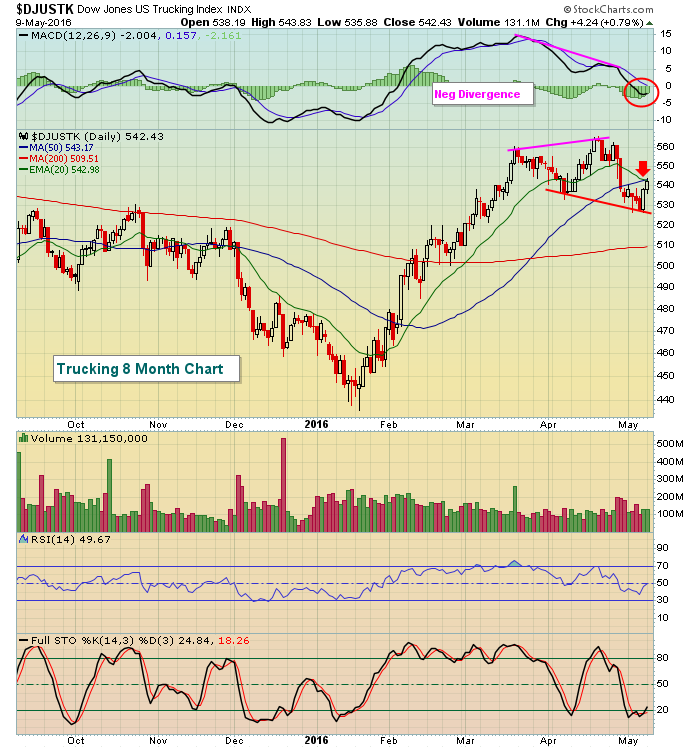 Like so many other areas of the market, the DJUSTK began to struggle after a nasty negative divergence appeared. The group went on to lose both its 20 day EMA and 50 day SMA and now has bounced to challenge both. We'll see if the bulls can clear those two key moving averages.
Historical Tendencies
Generally speaking, the 11th to the 18th of all calendar months tends to be quite strong with annualized returns of 13.82% on the S&P 500 since 1950. That's nearly 5 percentage points above the S&P 500's 9% average annual return throughout the year over the same period - quite convincing considering that there's been close to 4500 trading days from the 11th to the 18th.
May hasn't followed that pattern, however. In fact, since 1950 on the S&P 500, the May 11th to May 18th period has produced annualized returns of -6.50%, a far cry from what we typically see this time of the month.
Key Earnings Reports
(actual vs. estimate):
AGN: 3.04 vs 2.99
CS: reports loss, beats expectations (not posting numbers as I've seen differing accounts)
WWAV: .28 vs .26
(reports after close, estimate provided):
DIS: 1.40
EA: .30
SLF: .65
Key Economic Reports
March wholesale trade to be released at 10:00am EST: +0.3% (estimate)
Happy trading!
Tom


