Market Recap for Tuesday, May 10, 2016
Energy (XLE, +1.76%), industrials (XLI, +1.72%) and basic materials (XLB, +1.67%) led a wide participation rally on Tuesday that finished with all of our major indices up at least 1% (the Russell 2000 was the lone exception at +0.95%) and all nine sectors higher. Recently, as the rally off the February low has stalled, we've seen tons of bifurcation and uneven rallies so it was important to see most areas of the market moving higher in unison as key levels of support were tested.
The Dow Jones touched its 50 day SMA and essentially reset its MACD to zero line support last Friday. Climbing back above its 20 day EMA on Tuesday, the Dow Jones is now just 2+% from its all-time of 18351.40 and the negative divergence has been relieved. In the very near-term, the Dow Jones is trapped in a fairly narrow trading range. I want to see which way this consolidation breaks. Here's a visual:
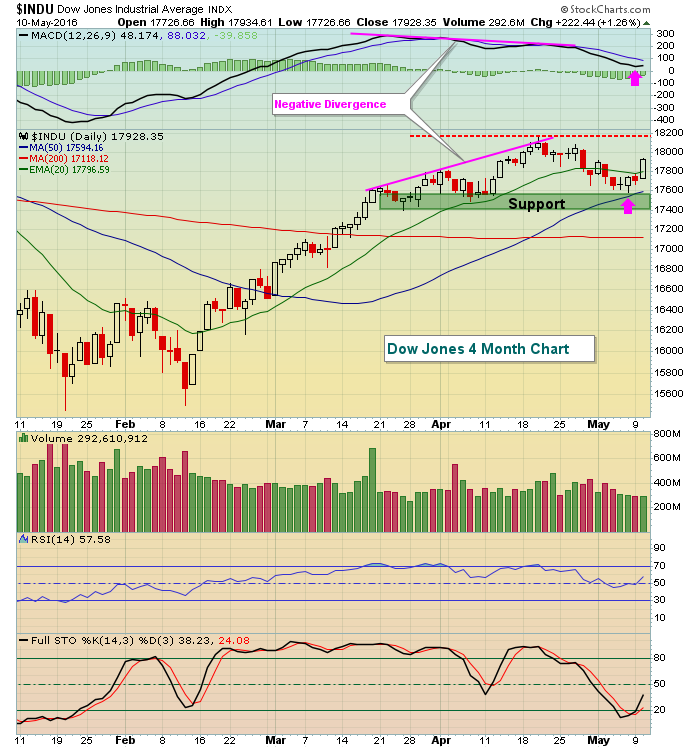 The past few weeks have been classic. A negative divergence followed by a 50 day SMA test/MACD reset (pink arrows). That unwinds the slowing momentum issue and allows the market "to be free again". The trading range extends from the bottom of the green shaded support area, or roughly 17400, and the red-dotted horizontal line just beneath 18200. A breakout would be bullish and likely send the Dow Jones quickly up to its 18351 all-time high.
Pre-Market Action
There's a slight downward bias to global markets as the Hang Seng ($HSI) fell nearly 1% in Asia overnight. German shares ($DAX) have fallen back below 10000 as that influential index straddles that psychological level.
Here in the U.S., futures appear to be on the verge of opening fractionally lower. Walt Disney (DIS) and Macy's (M) both are struggling in pre-market trade as market participants are not excited by the latest quarterly performance and outlooks from both companies. DIS and M are down 4.97% and 7.81%, respectively, at last check.
Current Outlook
It truly is a mixed picture. The strength in our major indices as they approach and consolidate just beneath all-time highs has a bullish feel to it. The problem is that money is not rotating toward offense (aggressive areas). Instead, we see treasuries (TLT), utilities (XLU) and consumer staples (XLP) continuing to outperform. With treasury yields so low - the 10 year treasury yield ($TNX) resides at 1.76% - market participants want to invest in U.S. equities, but are mostly favoring the higher-yielding areas. That doesn't have a bull market look and feel to it. So what do we do? Well, keep in mind that my trading strategy is of a very short-term nature. I believe capital preservation is priority #1 so I won't commit my portfolio to the U.S. stock market. I'm trading fewer shares and being highly selective and patient. I will only take a position if I can keep a tight closing stop in place. In other words, I have to be at or near a very important support level.
Also, consider that the S&P 500 closed at 2084 on Tuesday. On April 13th, we closed at 2082. On April 1st, we closed at 2072. We haven't seen a lot of movement over the past month and a half. When we run into a short-term trendless market, RSI 30-70 and stochastic 10-90 become key support levels on an hourly chart. Check out the S&P 500 over the past couple months on its hourly chart:
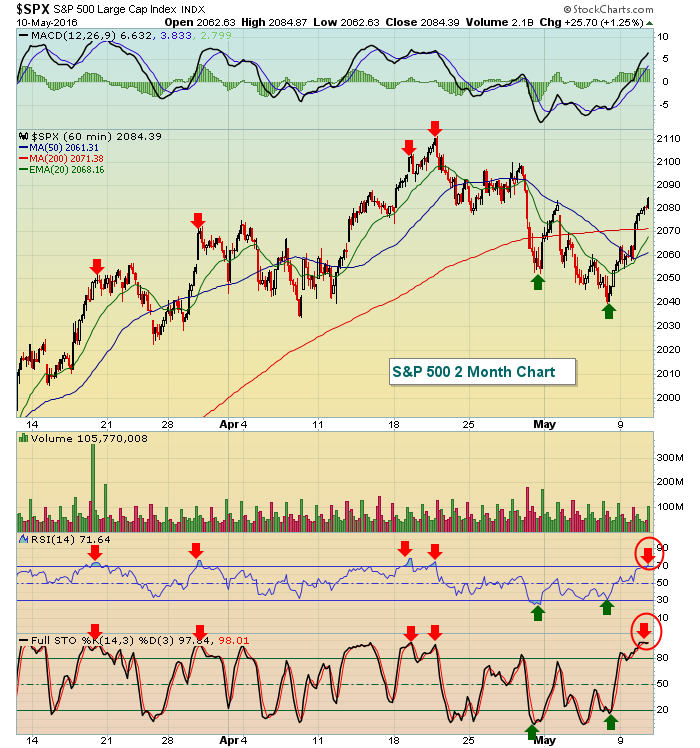 In an uptrending market, we should consider RSI support to be 40, but in a trendless market it becomes 30. The same holds true for the upside RSI targets. We become overbought at RSI 70 in a trendless market while it's not unusual to see the RSI remain overbought (70-80) for a period of time in a rising market. So the question becomes......are we in a trending market or a trendless market? Until we break out, I'd assume the latter, suggesting that Tuesday's RSI close of 71.64 should be respected.
Sector/Industry Watch
The Dow Jones U.S. Exploration & Production Index ($DJUSOS) has been trending higher since printing a double bottom at its January and February lows. It had struggled the past couple weeks, however, and reversed on Monday off a 50 day SMA test. Tuesday's gains of 2.78% further cemented Monday's low as a key short-term support level. Here's the current technical picture:
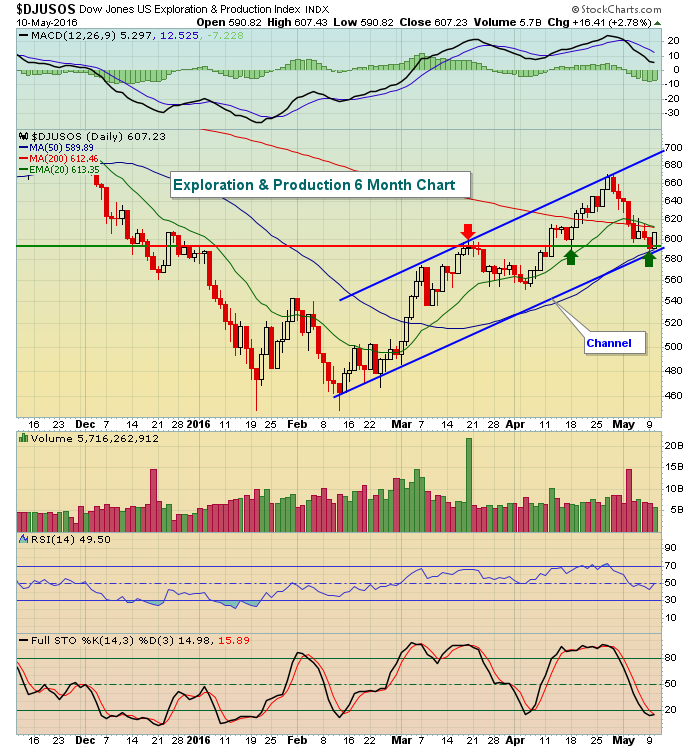 Energy has been leading the rally in 2016 and, if that continues, look for renewed strength from the exploration & production industry.
Historical Tendencies
Over the past 20 years, crude oil prices ($WTIC) have averaged rising in each of the first eight calendar months of the year, while averaging a loss for the final four months of the calendar year. You'd have to agree that 2016 is following the historical norm as oil prices have risen approximately 65% since the bottom in early February. Check out the seasonal numbers:
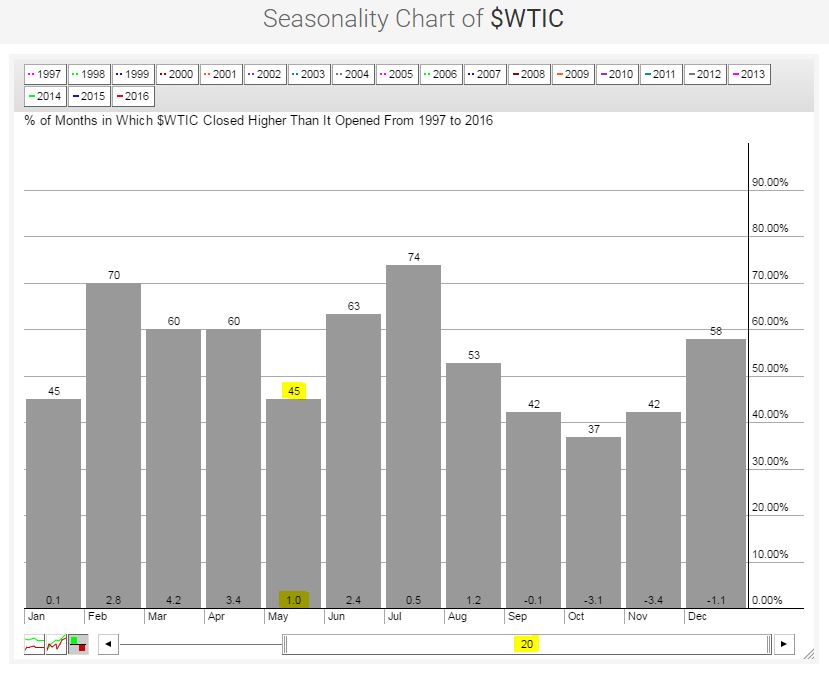 Note that May has only risen 45% of the time over the past 20 years and has averaged just a 1% gain over that same span. Those results aren't bad, but performance in surrounding months is generally much stronger.
Key Earnings Reports
(actual vs. estimate):
M: .40 vs .35
(reports after close, estimate provided):
CA: .52
JACK: .70
NTES: 2.31
Key Economic Reports
None
Happy trading!
Tom


