Market Recap for Friday, May 27, 2016
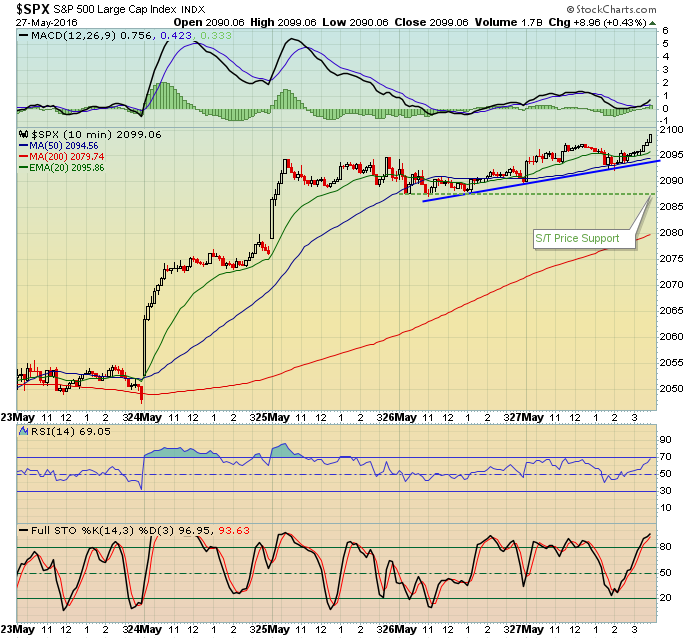
On a 10 minute chart, the S&P 500 bounced off its 50 period SMA and surged into the close, finishing near the 2100 level once again. Here's the latest intraday look at our benchmark index:
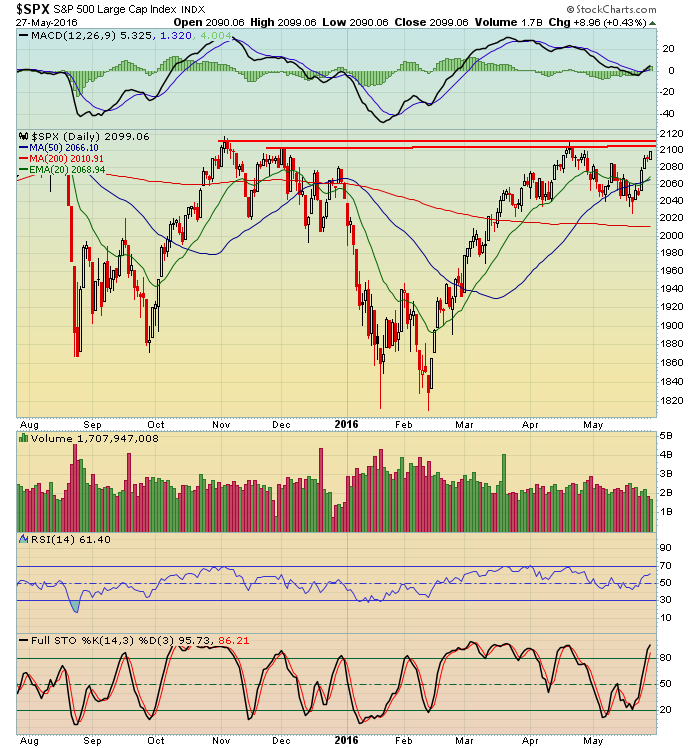
 The attempt at clearing 2100 is critical as the S&P 500 failed near that level in mid-April. Of course, the all-time high close on the S&P 500 is 2131. The following longer-term view shows the price resistance the bulls will face even if they're able to overcome the short-term price resistance and 60 minute negative divergence (60 minute chart not shown):
 It would be helpful if aggressive sectors lead on any breakout. On Friday, leadership did come from aggressive areas. Financials (XLF, +0.68%), technology (XLK, +0.48%) and consumer discretionary (XLY, +0.47%) were the three best performing sectors.
Pre-Market Action
U.S. futures are up slightly, looking to extend the rally late in the session on Friday. Upcoming overhead price resistance and 60 minute negative divergences will present short-term problems for the bulls, however.
Current Outlook
On the Russell 2000, the 60 minute chart shows a very wide trading range currently on this small cap index. This week is historically bullish so a breakout above resistance should be respected. On the flip side, if we cannot muster up enough strength to clear resistance by Friday, history suggests we could look for a June swoon to follow this week. Here's the latest look at the Russell 2000 on an extended 3 month 60 minute chart:
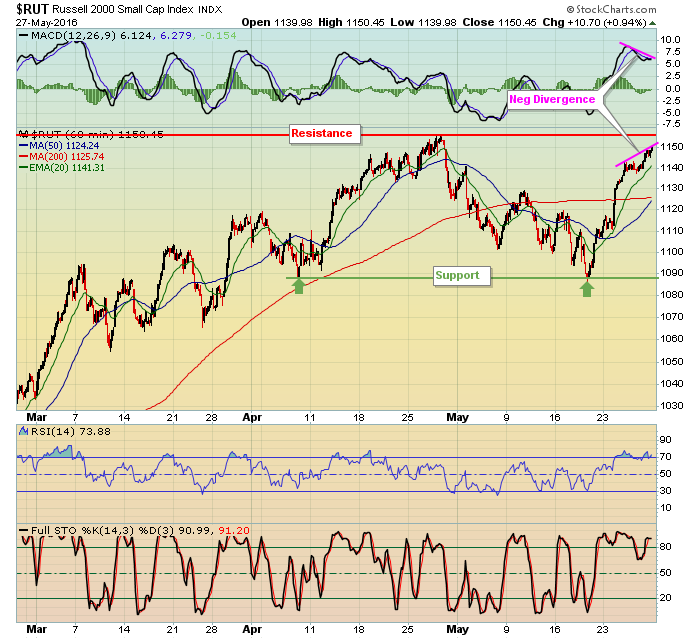 I spoke last week about negative divergences emerging on the 60 minute charts. These intraday negative divergences usually don't last long - perhaps one to three days - but this apparent slowing momentum could be just enough to keep the Russell 2000 from breaking out above the late April high.
Sector/Industry Watch
The Dow Jones U.S. Specialty Retailers Index ($DJUSRS) has surged in the latter half of May to offset the drubbing it took during the first half of the month. Below is the latest chart on the DJUSRS:
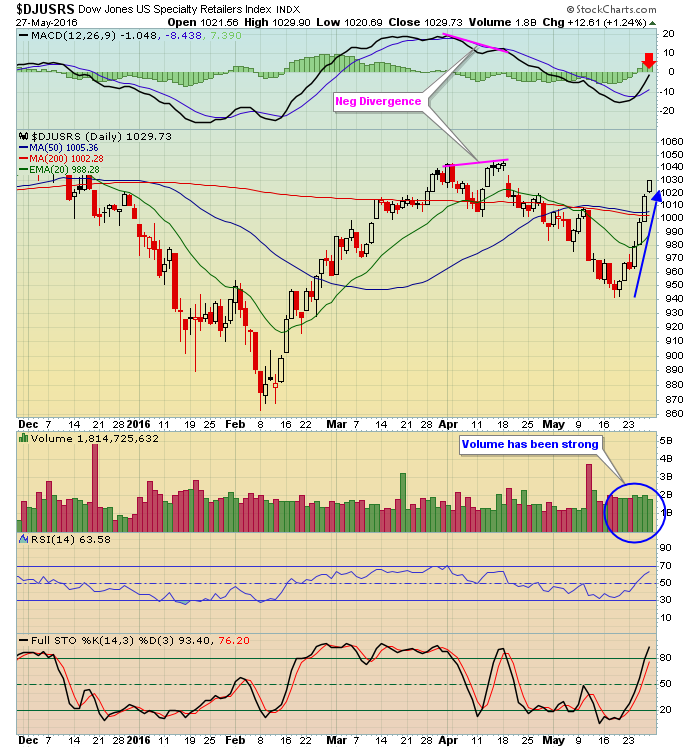 The DJUSRS has gained 10% in the past seven trading sessions as powerful moves in stocks like Netflix (NFLX) and Ulta Salon Cosmetics & Fragrances (ULTA) have more than offset horrid May performance in Office Depot (ODP), Conn's (CONN), Staples (SPLS) and Tiffany and Co (TIF).
Historical Tendencies
The 31st of all calendar months is typically quite bullish. Here are the annualized returns on our major indices for the 31st calendar day of all months (not just May):
S&P 500 (since 1950): +31.20%
NASDAQ (since 1971): +49.88%
Russell 2000 (since 1987): +75.58%
Key Earnings Reports
(actual vs. estimate):
MDT: 1.27 vs 1.26
(reports after close, estimate provided):
WDAY: (.39)
Key Economic Reports
April personal income released at 8:30am EST: +0.4% (actual) vs. +0.4% (estimate)
April personal spending released at 8:30am EST: +1.0% (actual) vs. +0.7% (estimate)
March Case Shiller 20-city index to be released at 9:00am EST: +0.7% (estimate)
May Chicago PMI to be released at 9:45am EST: 50.7 (estimate)
May consumer confidence to be released at 10:00am EST: 97.0 (estimate)
Happy trading!
Tom


