Market Recap for Wednesday, May 11, 2016
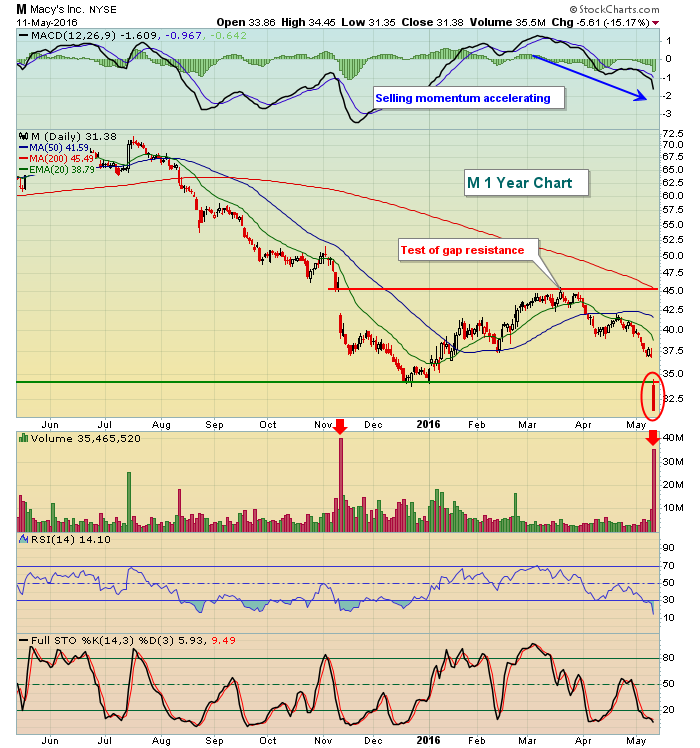
It was a bad day for consumer discretionary (XLY, -2.01%) and, in particular, retail stocks (XRT, -4.44%). Macy's (M) delivered an opening blow when their latest quarterly earnings report disappointed Wall Street. On the surface, it didn't appear to be too bad. After all, their quarterly EPS came in at .40 vs. a .35 estimate. But its revenues came in $174 million short of its expected $5.95 billion. The big blow, however, was M lowering its fiscal 2016 guidance from EPS of $3.80-$3.90 to $3.15-$3.40. That's a huge drop in projected earnings and the wide range suggests tremendous uncertainty. Wall Street loathes uncertainty and you can see it in the reaction to M's earnings report. Check this out:
 That's the definition of an ugly technical chart. High volume selling and leg lower after leg lower. M was a $70 stock in July and prior to yesterday's earnings report, it was a $37 stock. When a company loses roughly half its value in 9 months, that's a mass exodus and you should be expecting bad fundamental news. Personally, there's likely a LOT of bad news now built into the stock price. That doesn't mean M doesn't have further to drop, but valuation could begin to spark the interest of value investors as M falls.
The retail ETF (XRT) is reviewed below in the Sector/Industry Watch section.
Utilities (XLU, +0.37%) and energy (XLE, +0.31%) managed to eke out gains, while the other six sectors joined consumer discretionary in the red. REITs also had a relatively rough day, but that came after a recent breakout to fresh highs so a bit of profit taking may have been the primary culprit there.
Pre-Market Action
Kohl's (KSS) becomes the latest retail casualty as a result of earnings as the department store missed both its top line and bottom line estimates. The reaction? KSS is down 7.50% in pre-market action, potentially extending the big losses from Wednesday.
U.S. futures, however, are strong as Dow futures are up 70 on the back of higher crude oil prices. There was mixed action overnight in Asia, while European markets are fractionally higher.
The 10 year treasury yield ($TNX) remains stuck in the 1.70%-1.80% range. If anything, this suggests to me that bond traders are not looking for much economic improvement in the months ahead - perhaps an economy that continues to grow at a very slow pace with little action from the FOMC.
Current Outlook
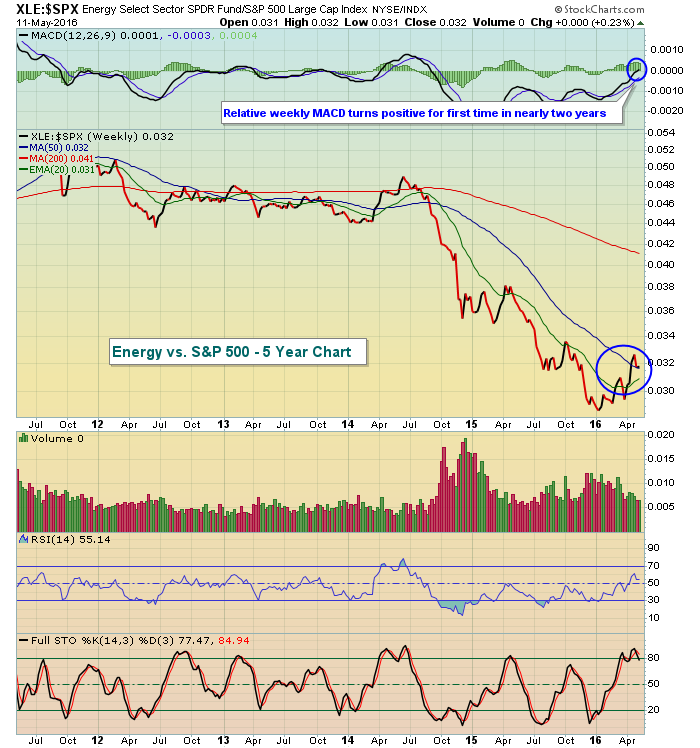
The back and forth yo-yo continues. Tuesday's gains evaporated throughout Wednesday's session and we remain in the consolidation period that I described in my blog yesterday. Energy (XLE) should remain a primary focus as that sector has been outperforming the S&P 500 since the early 2016 low was established. That comes on the heels of 18 months of relative underperformance so the renewed relative strength could be here for awhile. Here's the long-term relative chart of the XLE vs. the S&P 500:
 The small blue circle shows the relative momentum building with a bullish MACD centerline crossover. That hadn't happened in almost two years. More importantly, the big blue circle shows the price action improving with the 20 week relative EMA now rising solidly. I want to see the relative performance line remain above that rising 20 week relative EMA in much the same way that the relative price action remained below that 20 week relative EMA for the year and a half beginning in the 3rd quarter of 2014.
Sector/Industry Watch
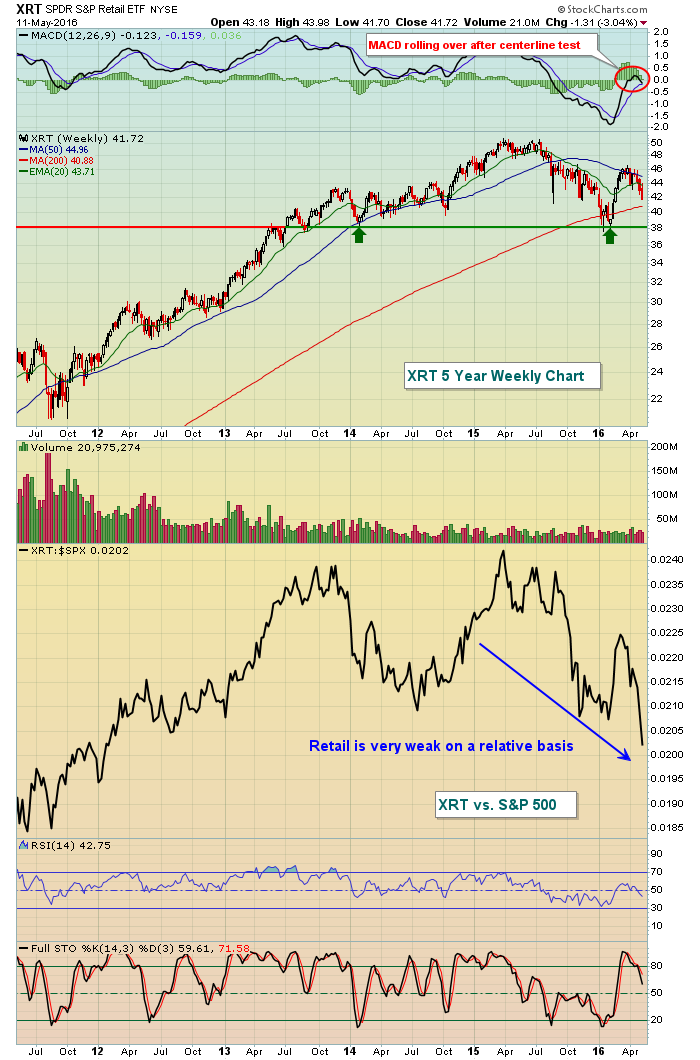
To put it mildly, retail investors had a very rough day. Amazon.com (AMZN) managed to avoid the barrage of sellers, but there weren't many other places to turn in retail. The XRT is a very diverse group of retail holdings. For instance, the largest holding as of April 28th was Outerwall (OUTR) at 1.40% of total assets. AMZN was second at 1.33%. So you can see no one stock will have a big effect on the overall performance of the XRT. Given that diversification, take a look at how the XRT shapes up technically from a long-term perspective:
 Critical long-term price support resides closer to 38. Given the fact that retail has broken down on a relative basis vs. the S&P 500, it's difficult imagining that the XRT isn't going to test that 38 level again in time. Once there, however, it could be a great time to consider owning certain retail stocks based on valuation alone. The ability to set tight stops would be added bonus.
By the way, the April retail sales report will be released Friday morning at 8:30am EST. Buckle your seat belts.
Historical Tendencies
We're currently in a historical lull from May 6th through May 25th where the U.S. equity market has struggled. For what it's worth, May 12th has produced an annualized return of 86.43% on the Russell 2000 since 1987. That's the good news. The bad news? May 13th has given up most of those gains with an annualized return of -76.34%.
Key Earnings Reports
(actual vs. estimate):
KSS: .31 vs .36
PRGO: 1.75 vs 1.73
RL: .88 vs .83
(reports after close, estimate provided):
JWN: .45
NVDA: .31
SYMC: .19
Key Economic Reports
Initial jobless claims released at 8:30am EST: 294,000 (actual) vs. 267,000 (estimate)
Happy trading!
Tom


