Market Recap for Monday, May 23, 2016
Despite seven of nine sectors finishing lower, the major U.S. indices managed to close near the flat line due to strength in basic materials (XLB, +1.17%). Consumer staples (XLP, +0.10%) was the only other sector in positive territory at the closing bell. The XLB and XLP fashion two of the three best SCTRs among the sector ETFs at 89.5 and 84.8, respectively. Utilities (XLU, -0.89%) was the worst performing sector, but remains the SCTR leader at 93.4. In light of another potential interest rate hike by the Fed, the XLU has been weakening, highlighted by a death cross (20 day EMA slipping beneath 50 day SMA). Check it out:
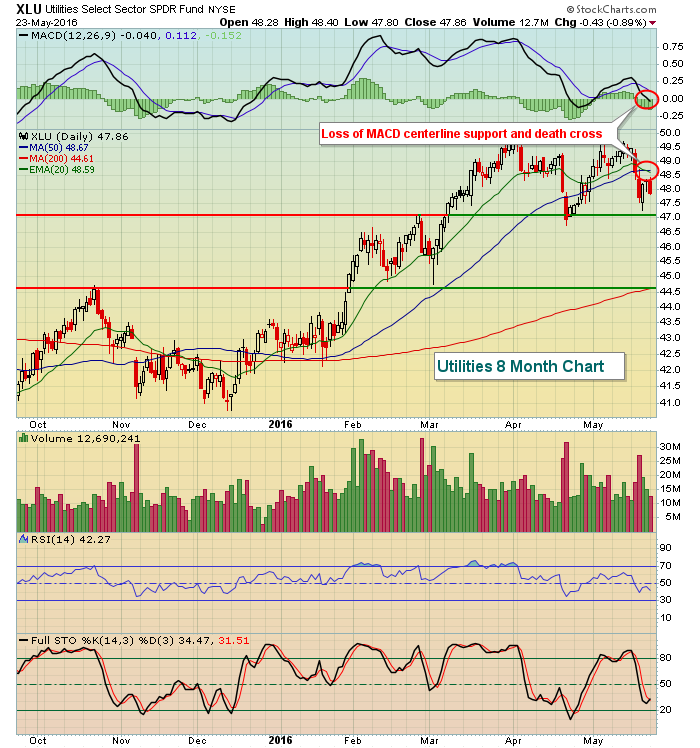 Failure to hold recent price lows could be a problem for the XLU as momentum has begun to swing to the bears' side.
Most areas of the materials sector showed strength on Monday, with gold (GLD, -0.28%) an exception. The GLD's recent weakness stems from renewed strength in the U.S. dollar ($USD, -0.05%) in May. The inverse correlation between the two is highlighted below in the Sector/Industry Watch section.
Pre-Market Action
U.S. futures are suggesting that we'll see a nice open to start the trading session. Dow futures are up nearly 100 and this coincides with yet another increase in the U.S. Dollar Index this morning. Microsoft (MSFT) received an upgrade, adding to the early bullish bias.
Asian markets were mostly lower overnight, but the U.S. seems to be taking its cue from European markets, especially in Germany where the DAX is higher by 1.46% and is nearing the 10000 level once again.
Toll Brothers (TOL) beat revenue and EPS estimates and raised their outlook slightly and that's providing an early boost to homebuilders ($DJUSHB). New home sales for April will be reported later this morning, following by FHFA house price index on Wednesday and April pending home sales on Thursday so the DJUSHB will be watched closely over the balance of this week.
Current Outlook
The NASDAQ 100 ($NDX) represents the biggest non-financial names on the NASDAQ. This is a group where I look to for leadership. Recently, the NDX has struggled to clear its declining 20 day EMA and its momentum oscillators are all stuck in neutral. Its MACD is slightly beneath centerline support and its RSI and stochastic are at 47 and 49, respectively, both very close to that neutral 50 level. In order to improve the short-term prospects of the stock market, the NDX needs to clear its 20 day EMA and it also must begin to trade better relative to the S&P 500. Here's the visual of both:
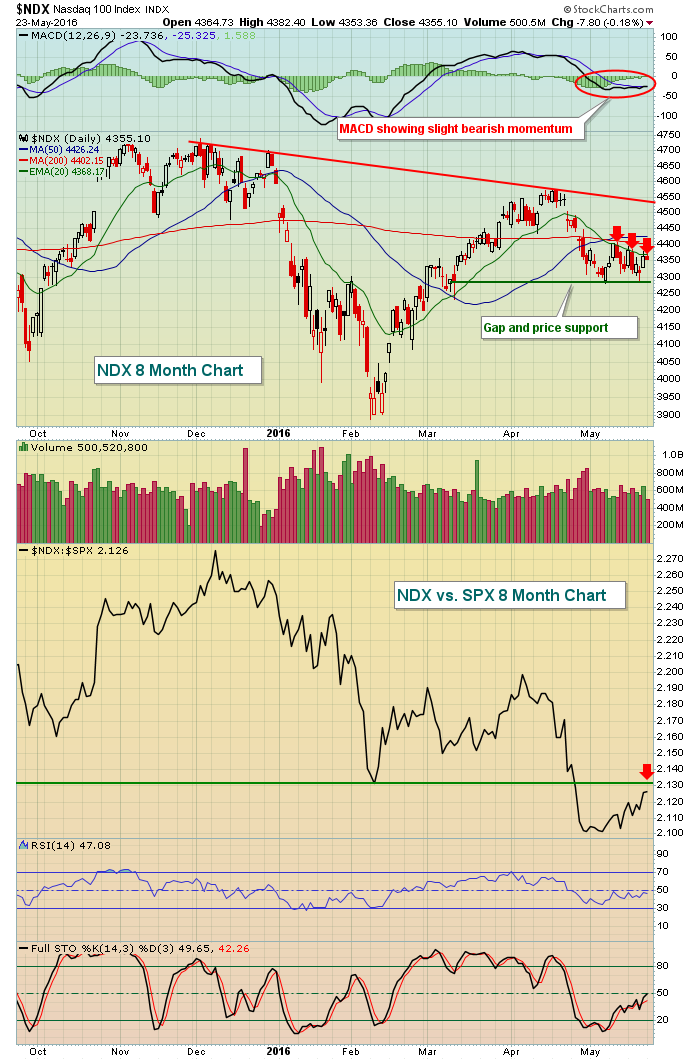 The three red arrows on the NDX price chart shows the difficulty the index has had moving back through its 20 day EMA. The single red arrow on the relative chart shows that the NDX:SPX still must clear its most recent relative breakdown level at 2.13. The key price support level on the NDX is approximately 4285, the area of both gap (in second week of March) and price support.
Sector/Industry Watch
The U.S. Dollar Index ($USD) and gold (GLD) have always had an inverse correlation, meaning that over time, when one moves higher, the other moves lower. Below is a chart of both, showing this relationship to once again be true in May. Take a look:
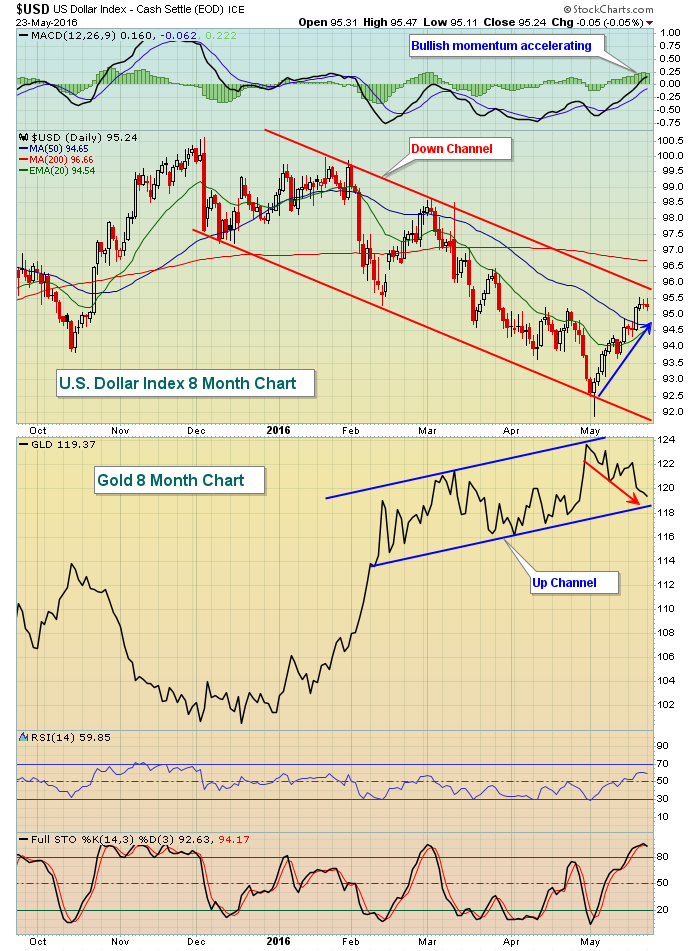 May has been a very rough month for gold prices, but check out the stealth move higher in the U.S. dollar. The USD is now approaching trendline support with a positive MACD and its other momentum oscillators stretched to the upside. During a downtrend, RSI 60 and stochastic above 90 tend to mark tops. Currently, the USD has readings of 59.85 and 92.63, respectively. If you're bearish the dollar, you really don't want to see the upper downtrend line cleared.
Historical Tendencies
Here are the annualized returns for each of the following indices for the period May 25th through June 6th:
S&P 500: +28.63% since 1950
NASDAQ: +50.64% since 1971 (bullish period ends June 5th)
Russell 2000: +64.59% since 1987 (bullish period also ends June 5th)
While this never serves as a guarantee, history has made it clear that the upcoming couple weeks typically result in a rise in U.S. equities.
Key Earnings Reports
(actual vs. estimate):
AZO: 10.77 vs 10.96
BBY: .44 vs .35
TOL: .51 vs .48
VAL: 1.22 vs 1.26
(reports after close, estimate provided):
CSC: .68
INTU: 3.03
Key Economic Reports
April new home sales to be released at 10:00am EST: 523,000 (estimate)
Happy trading!
Tom


