Market Recap for Wednesday, June 1, 2016
Consumer staples (XLP, +1.03%) surged higher on Wednesday. Unfortunately, the other sectors didn't get the memo. Seven of the nine sectors did finish higher, but healthcare (XLV, +0.36%) was a distant second and the two sectors finishing in the red were consumer discretionary (XLY, -0.06%) and technology (XLK, -0.25%). The Dow Jones U.S. Brewers Index ($DJUSDB) gained more than 3% on Wednesday as its recent uptrend remains intact with yet another breakout. Here's the visual:
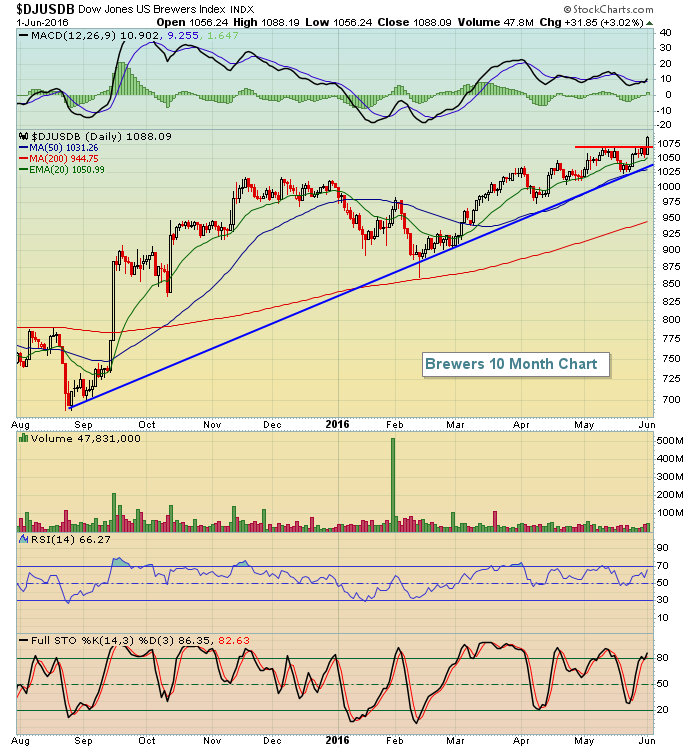 Molson Coors Brewing (TAP) was the leading brewer on Wednesday and helped to lead this group on a relative basis.
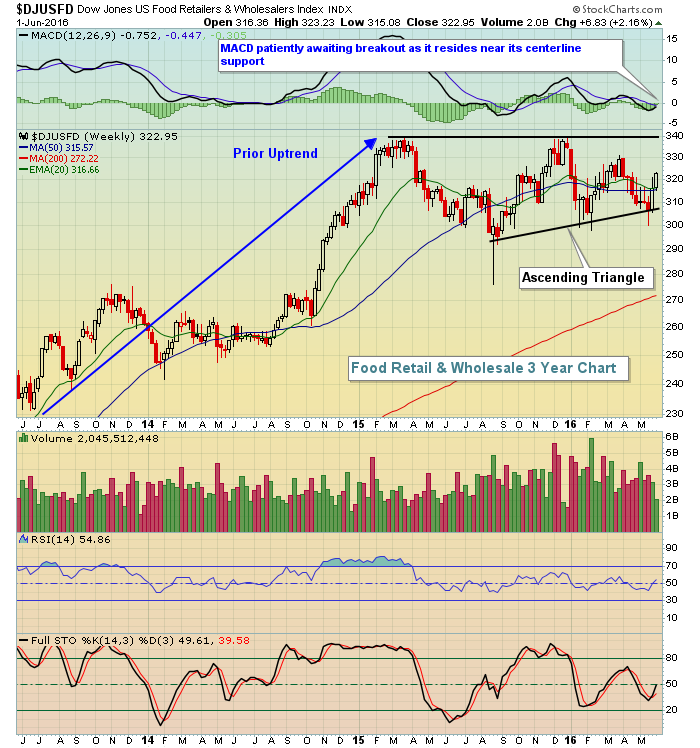
Another star on Wednesday was the Dow Jones U.S. Food Retailers & Wholesalers Index ($DJUSFD), which gained 2.31% and looks very bullish on its weekly chart, as reflected below:
 Computer hardware ($DJUSCR) was weak yesterday as Apple (AAPL) recently moved into a key gap resistance zone. As AAPL pulls back, the rising 20 day EMA should provide support. We'll see.
Pre-Market Action
U.S. futures are down slightly this morning as they search for something to extend the current rally. Unfortunately, both the ADP employment report and initial jobless claims matched or were very close to Wall Street expectations. Overnight, the Tokyo Nikkei ($NIKK) fell more than 2% while other key Asian markets posted modest gains. In Europe, we're seeing a bit of weakness.
Overhead resistance on the S&P 500 from 2100-2131 is very real and we've seen multiple failed attempts at breakouts there. Until it happens, caution is suggested.
Current Outlook
The S&P 500 continues to knock on the door of all-time high price resistance despite uncertainty over interest rates, Fed policies, the upcoming presidential election, Friday's nonfarm payroll report, etc. They say a picture paints a thousand words and the long-term S&P 500 chart certainly is painting something. Take a look:
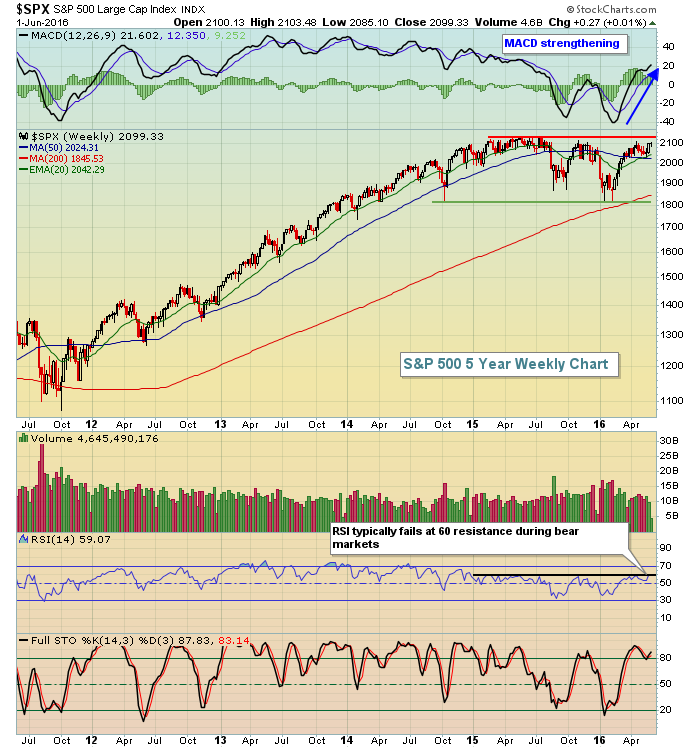 In a nutshell, this chart says it all. Can we make the breakout? Can we do it during the seasonally rough summer months? Will aggressive groups lead such a breakout? And for the bears, the weekly RSI has struggled to clear 60 resistance for the past 18 months. Will it fail again? Perhaps the latest employment report - due out tomorrow morning at 8:30am EST - will provide either the bulls or bears the fuel they need to make their case.
Sector/Industry Watch
Normally, I don't consider stocks as they head into their quarterly earnings report. But Ambarella (AMBA) reports tonight out of the strengthening semiconductor space and AMBA has not been participating in the move higher. Any good news out of AMBA could send the stock soaring to catch up, however. Both price and volume are suggesting that the downside momentum is slowing. Check out AMBA's longer-term weekly chart:
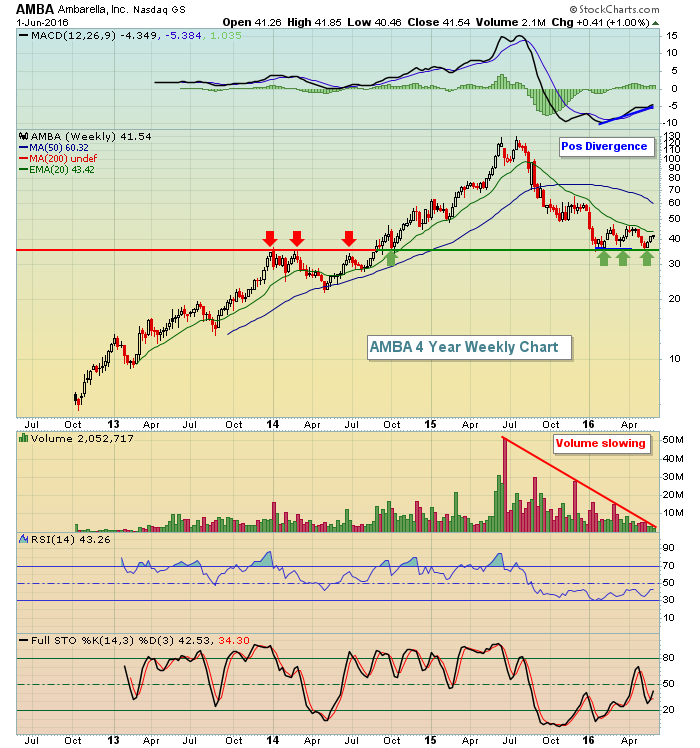 One of two bullish scenarios could develop here. Either AMBA reports results that top expectations and it soars on Friday or another disappointment sends AMBA down at the open, only to recover and print a hollow reversing candle close to its recent price support.
Historical Tendencies
June 2nd represents the strongest day of the calendar month historically on the NASDAQ, where it's produced annualized returns of 110.14% since 1971.
Key Earnings Reports
(reports after close, estimate provided):
AMBA: .02
AVGO: 2.00
COO: 1.92
Key Economic Reports
May ADP employment report released at 8:15am EST: 173,000 (actual) vs. 175,000 (estimate)
Initial jobless claims released at 8:30am EST: 267,000 (actual) vs. 267,000 (estimate)
Happy trading!
Tom


