Market Recap for Friday, June 10, 2016
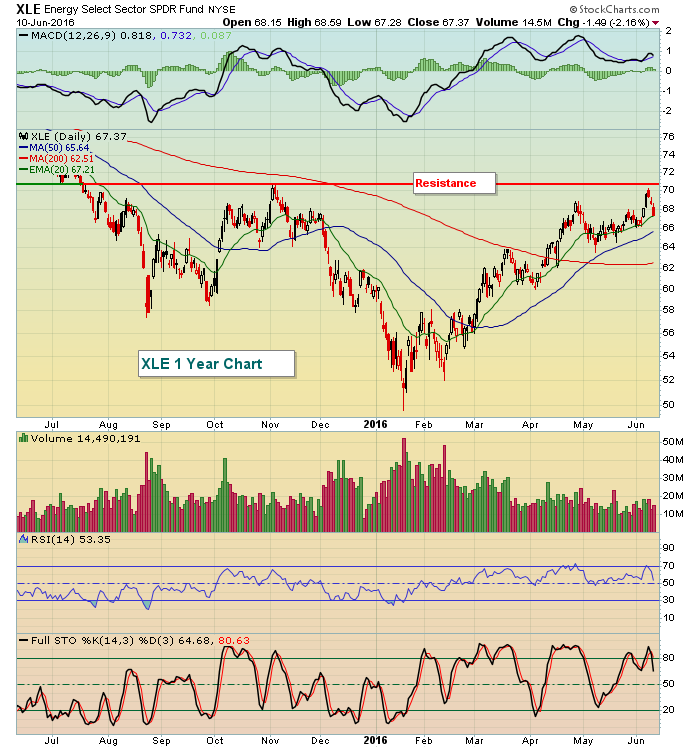
Consumer staples (XLP, +0.07%) eked out a tiny gain on Friday, but otherwise sector performance was weak. The eight remaining sectors all finished in the red with energy (XLE, -2.16%) leading the pack. The weekly candle on crude oil prices ($WTIC) is quite ominous and the reversing candle took place at price resistance. Here's the final candle look at the WTIC last week:
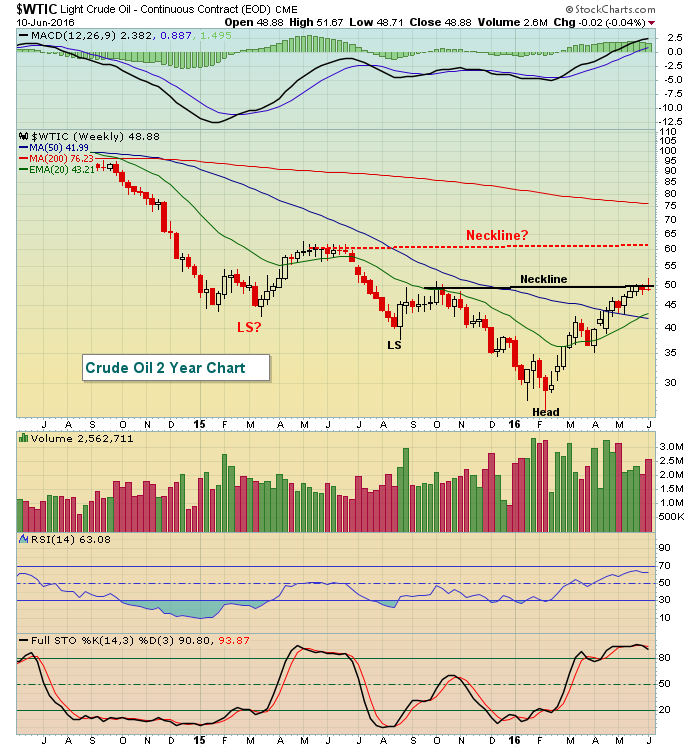 The good news is that crude oil appears to be printing a bottoming longer-term reverse head & shoulders pattern. The bad news is we may have established the right side of the neckline with last week's candle failure just above $50 per barrel. If that's the case, then look for the rising 20 week EMA, currently at 43.21 to offer up support on a test there. A more bullish scenario would develop if the WTIC can clear last week's highs. The red outlined reverse head & shoulders pattern would suggest another $10 rise per barrel in crude oil prices, allowing the XLE to break above its recent price resistance as shown below:
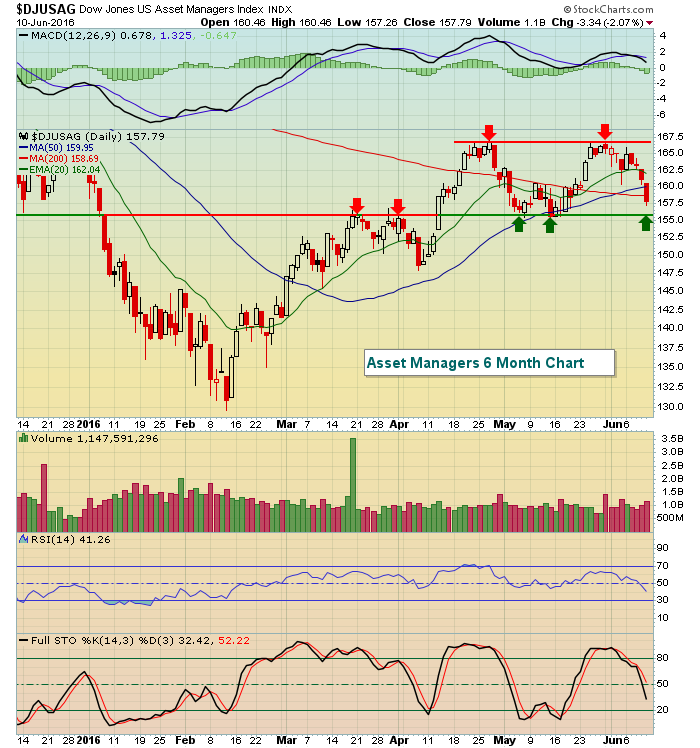
 Financial stocks (XLF, -1.24%) also were hit hard on Friday and were the worst performing sector last week. Life insurance, bank, investment services and asset managers all closed below their respective 50 day SMAs on Friday as lower treasury yields lower EPS expectations on these financial stocks. Asset managers ($DJUSAG) are the focus of the Sector/Industry Watch section below.
Pre-Market Action
It's a very quiet day in terms of news. There are no significant earnings reports or economic reports.
Steep losses overnight in Asia, combined with more losses in Europe, have U.S. futures on the defensive. The Dow Jones futures are lower by 64 points, although Microsoft (MSFT) has announced plans to buy LinkedIn (LNKD) for $26 billion. LNKD is higher by 48% in pre-market trading.
Current Outlook
After several months of strong price action on the S&P 500, there is the potential of a short-term top in place now, especially with energy shares poised for a further decline. Energy has been leading the S&P 500 throughout much of the rally. There are two keys to watch on the S&P 500 - in terms of price action. There are plenty of other "under the surface" areas to watch. But price action is obvious to me. Take a look:
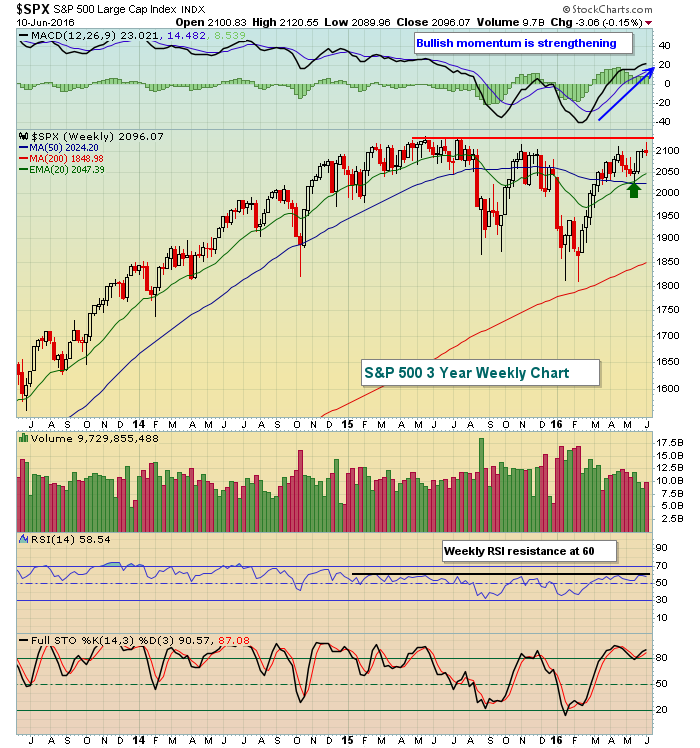 On this long-term weekly chart, price resistance clearly remains at the all-time high close at 2131. To the downside, watch the rising 20 week EMA. That held on its most recent test and could be tested again soon. That moving average currently resides at 2047, so let's call the current trading range 2047-2131.
Sector/Industry Watch
Asset managers ($DJUSAG) had been looking quite strong technically until printing a double top print in late May. Also, a 60 minute negative divergence emerged simultaneously, indicative of slowing short-term upside momentum. Have a look at the daily chart to visualize the resistance being hit, then the 60 minute chart to see the slowing momentum:
Daily:
 Now the 60 minute chart.....
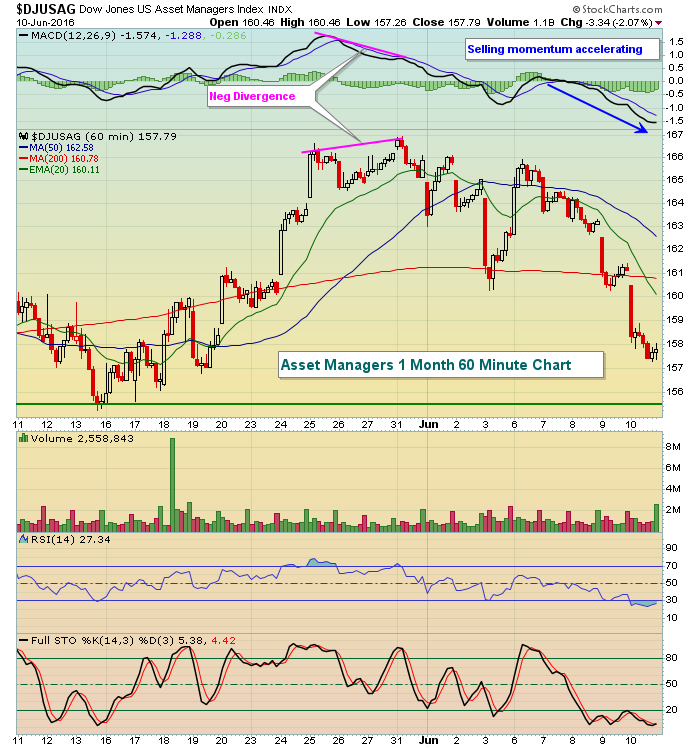 This helps to illustrate how you can anticipate tops in the stock market. At the time a double top formed on the daily chart, a negative divergence was printing on the 60 minute chart. This never guarantees us a certain outcome, but it alerts us to the fact that the risks are growing.
It appears that the DJUSAG is heading towards a test of support near 155.50. Should a positive divergence emerge as that level is tested, it would provide a solid reward to risk entry on the long side into the group.
Historical Tendencies
While June tends to be a poor calendar month for asset managers, there's been historical relief during the month of July so perhaps the worst will be over for asset managers when the current period of selling ends. Here's a look at the historical tendencies for the DJUSAG throughout the year:
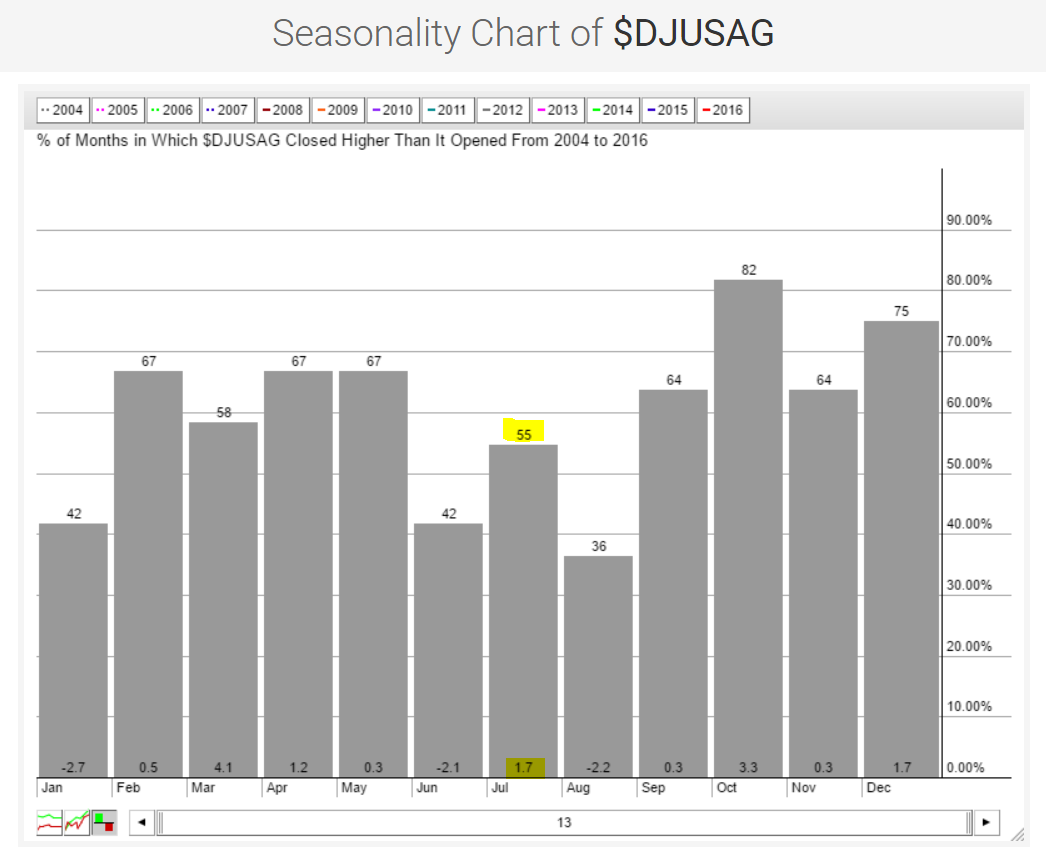 This industry group seems to bounce in July, but it is sandwiched by two weak calendar months in June and August. Overall, the summer months are fairly bearish so if price support on the DJUSAG near 155.50 is lost, buyer beware.
Key Earnings Reports
None
Key Economic Reports
None
Happy trading!
Tom


