Market Recap for Thursday, June 9, 2016
Utilities (XLU, +0.86%) and consumer staples (XLP, +0.39%) - two defensive sectors - led the action on Thursday and contributed heavily to the reversal in U.S. equities after a weak opening hour. Unfortunately, we want to see traders turn more aggressive when buying kicks in and that did not occur. Action in the bond market tells me we could be printing a top. We'll see.
We've been trending higher with fairly strong daily MACDs in place. Therefore, one key test to watch will be how the stock market reacts when rising 20 day EMAs are challenged. Thus far, buyers have returned exactly where expected. But beware if that changes.
While industrials (XLI, -0.02%) were flat on the session, airlines ($DJUSAR, +1.72%) cleared short-term price resistance near 210 after holding critical price support near 200. Check it out:
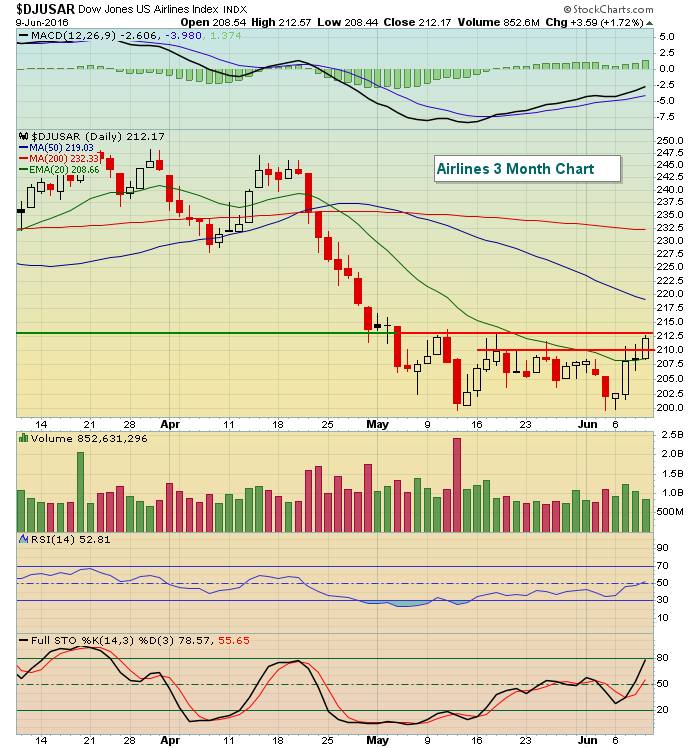 Crude oil prices ($WTIC) are stumbling a bit after finally clearing $50 per barrel resistance. Higher oil definitely created problems for airlines, but the recent profit taking in crude oil has sent traders back into the airlines space, especially since technical support at 200 held. Further strength in airlines to clear 212-213 would likely send the group higher to at least test its 50 day SMA, currently at 219.
Pre-Market Action
Overnight, China's Shanghai Composite ($SSEC) was closed, but other key Asian markets retreated. That weakness accelerated in Europe with most of the major indices there trading down by approximately 2%. The German DAX was down 2.32% at last check as that influential index is trading below 10,000 once again.
Treasuries are again in favor with the 10 year treasury yield ($TNX) dropping down to 1.67%, perilously close to its key yield support near 1.64%-1.65%. A drop in the TNX beneath 1.64% could trigger significant selling in equities and the Volatility Index ($VIX) has been rising the past few sessions to support that notion.
Dow Jones futures are down 100 points this morning as the bulls will likely be challenged at the opening bell.
Current Outlook
On the surface, the action yesterday wasn't bad at all. We've been rising continuously since the third week of May and truthfully our major indices needed a pause. So when the selling kicked in on Thursday morning, there was little panic. In fact, the initial drop was taken perfectly in stride and buyers returned once again and trimmed losses to a manageable level by the close. It certainly seemed comfortable. But the big problem couldn't be seen on the surface. You had to look a little deeper.
Treasuries were once again in favor as the 10 year treasury yield ($TNX) closed at 1.68%, its lowest close since February 11th when the S&P 500 found its bottom. So while the S&P 500 has marched significantly higher over the past 4 months, the TNX has stayed put. That tells me that the bond market is anticipating something a whole lot worse than the stock market and the bond market is normally correct.
Check out the 10 year treasury yield chart:
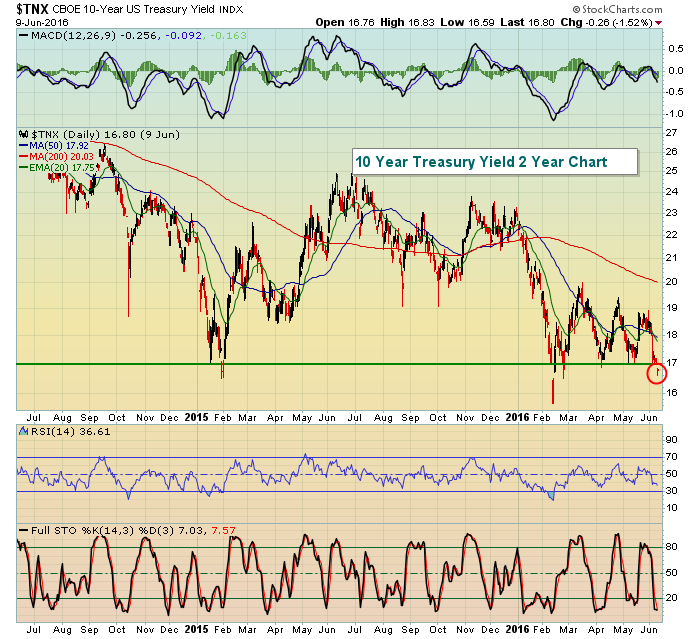 We can never rely on just one chart, but the fact that money remains in treasuries and isn't supporting the "stronger economy ahead" theory that the Fed is pushing suggests we could still see plenty of pot holes ahead in terms of stock market performance.
Sector/Industry Watch
Utilities (XLU) are once again on a tear. They've broken out on an absolute basis and are threatening to crack trendline resistance relative to the S&P 500. Like the discussion above on the treasuries, relative strength in utilities is generally a negative for future stock market performance. It's normal for utilities to lead for brief periods as profit taking kicks in for equities after a nice trend higher. But utilities are leading the advance and that leaves me questioning the sustainability of the S&P 500's advance and its ultimate breakout. Take a look at this chart:
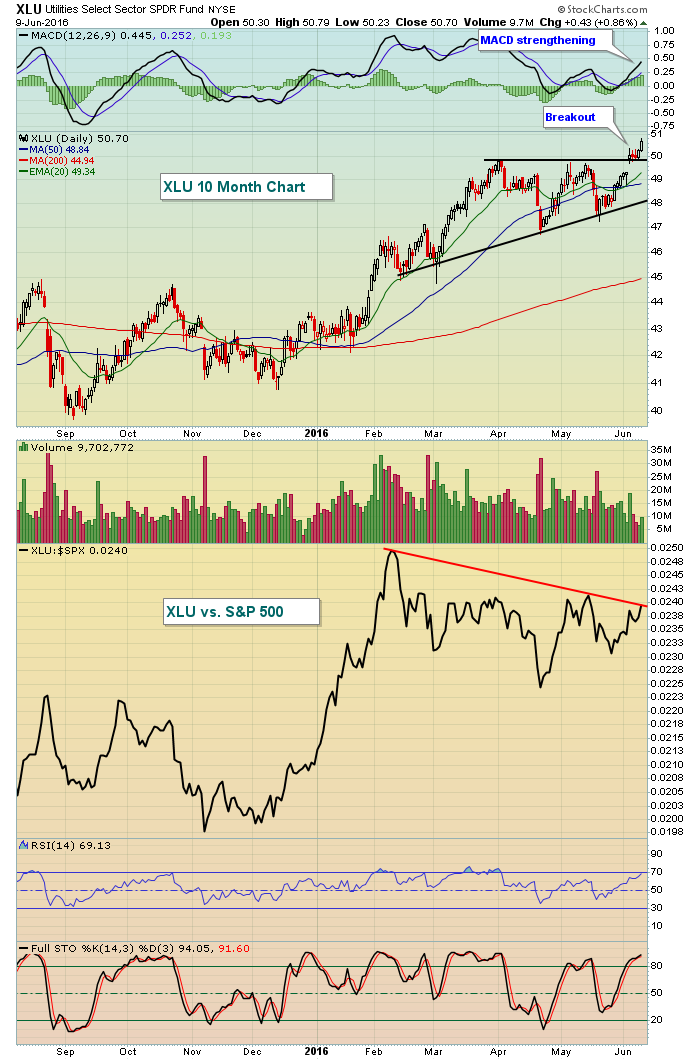 Another relative breakout would only add to the bullishness of utilities - to the possible detriment of the overall U.S. stock market.
Historical Tendencies
Beginning June 11th (Saturday this year), the NASDAQ has negative annualized returns on 10 of the next 16 calendar days through June 26th. The worst time is from June 18th through June 26th. The next week or so is more neutral with a slight bearish historical slant.
Key Earnings Reports
None
Key Economic Reports
June consumer sentiment to be released at 10am EST: 94.5 (estimate)
Happy trading!
Tom


