Market Recap for Monday, June 13, 2016
It was not a good day for the bulls. Global markets were weak and that set the stage for selling here in the U.S. Losses were fairly contained throughout the early part of the day, but the final hour saw the losses on the Dow Jones double. Technology (XLK, -1.11%) was once again an area that saw more than its fair share of selling with consumer electronics ($DJUSCE) down 1.84%. Selling in internet stocks ($DJUSNS) intensified as volume picked up. Key support levels are approaching in this influential space as reflected below:
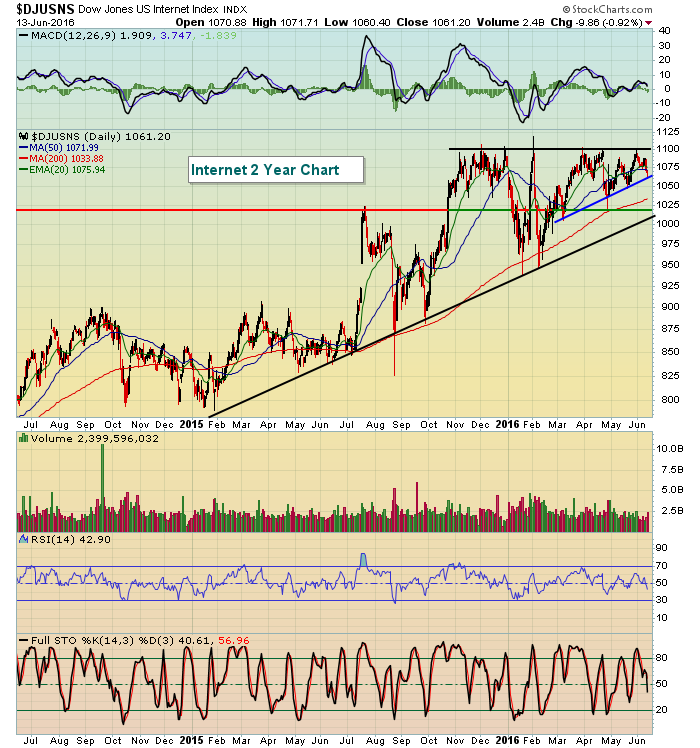 The blue trendline is being tested currently with the most recent price low near 1050. So in the near-term, 1050-1060 represents fairly big support. The bigger picture remains solid, but loss of 1050 could quickly lead to a much more significant test of the long-term trendline.
Utilities (XLU, -0.12%) and energy (XLE, -0.30%) were the two relative leaders as no sector escaped the selling from Monday.
Pre-Market Action
One big problem with the U.S. stock market is that few are willing to take risks. We see it in a number of areas, but none is more apparent than what we're seeing with treasury prices. Money continues to rotate towards treasuries with the 10 year treasury yield on a steady decline. A major yield support level is here and a break below it would signal that more bearish days are ahead for stock prices. Check out the chart:
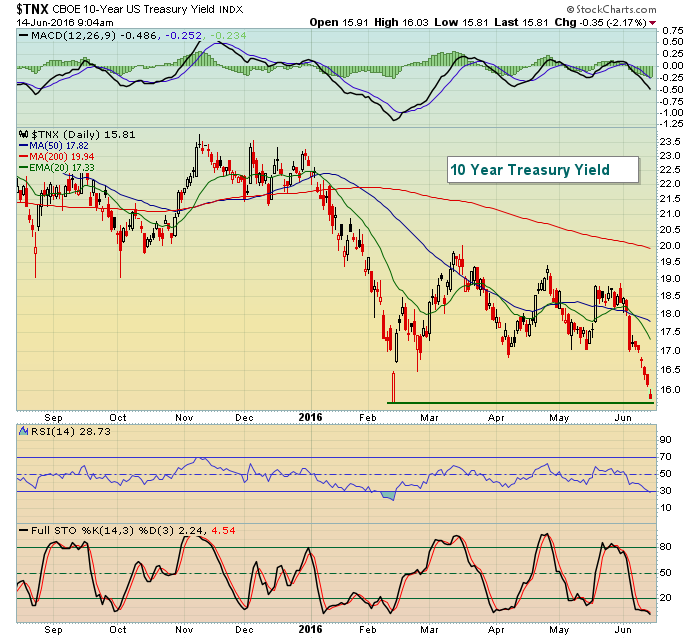 The timing of this yield support test is interesing as the FOMC begins a two day meeting to discuss monetary policy. The Fed's latest announcement will occur at 2pm EST tomorrow. Trading between now and then will be interesting, to say the least.
Dow Jones futures look to extend the losses yesterday as they're down 44 points as we near the start of another trading day.
Current Outlook
It always makes me nervous when equity prices are rising, but the Volatility Index ($VIX) shows increasing fear. Why? Because typically the market becomes complacent (lower VIX) as the S&P 500 moves higher. Last week, I wrote about whether the rising VIX (in a rising S&P 500 environment) was sending us a warning signal. We're now getting our answer. Large losses in stocks do NOT occur without the VIX rising significantly. Below is a long-term weekly chart. Check out the VIX during periods where the S&P 500 declines:
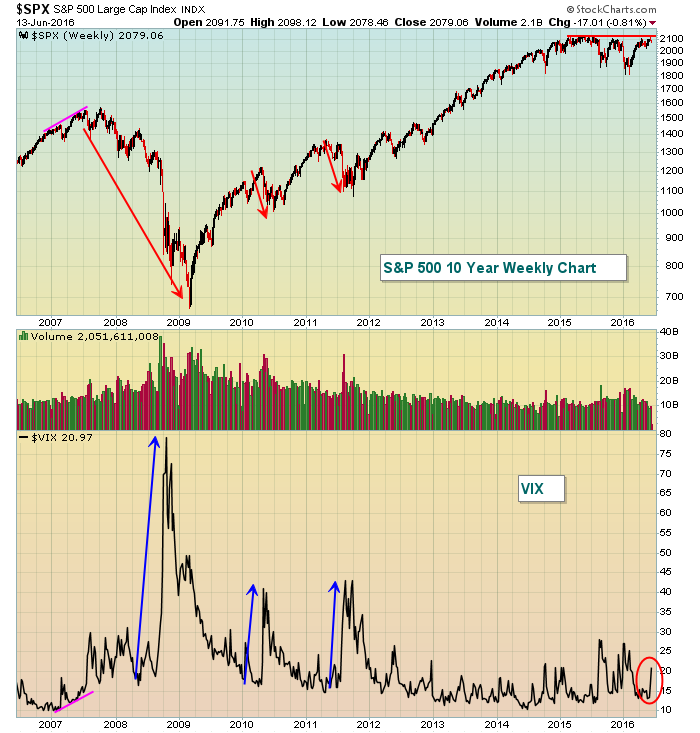 The pink lines at the far left of the chart show the VIX rising before the bear market began. And it's not shown above, but money began rotating to defense before the decline began as well. That's the same scenario we're looking at now. I'm not saying this is the start of a bear market as price action would need to confirm that, but what I am saying is that the risk of holding U.S. equities at this time is clearly on the rise.
Sector/Industry Watch
The Dow Jones U.S. Bank Index ($DJUSBK) lost both trendline support and its 50 day SMA recently and now is resting just above a critical price support zone. Loss of that support would likely lead to further price deterioration at a time when the overall stock market is showing signs of topping in the near-term, perhaps the long-term. Here's the chart on the DJUSBK:
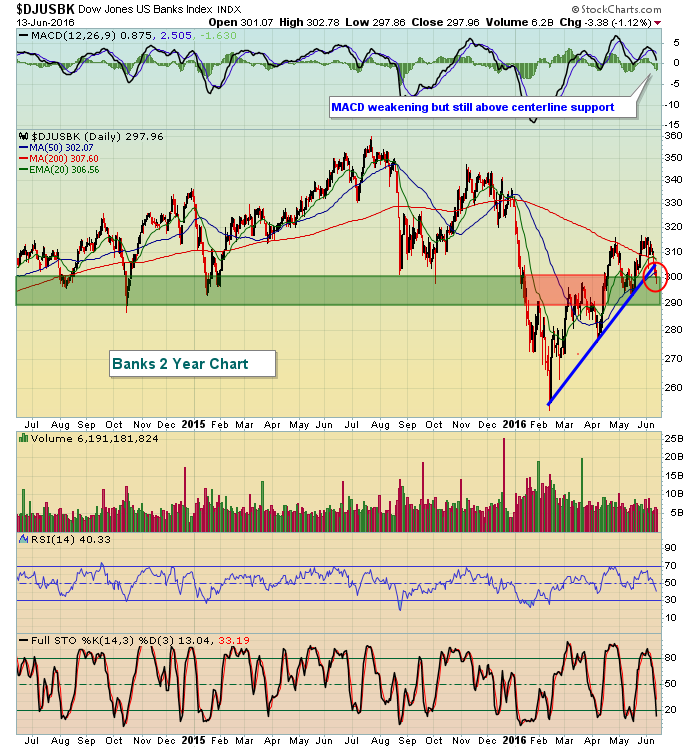 The MACD has turned down but hasn't yet moved into negative territory. That will likely happen, however, if the price support zone from 290-300 doesn't hold. One other technical indication to keep an eye on is the level of the RSI. Currently, the RSI is at 40 and that's generally where it turns during an uptrend. Failure to hold MACD centerline support and RSI 40, coupled with a price breakdown beneath 290, would spell trouble for this influential financial group.
Historical Tendencies
It's also worth noting that banks perform poorly during the month of June - at least that's been the case when looking at returns over the past 17 years. Check out the seasonal tendencies:
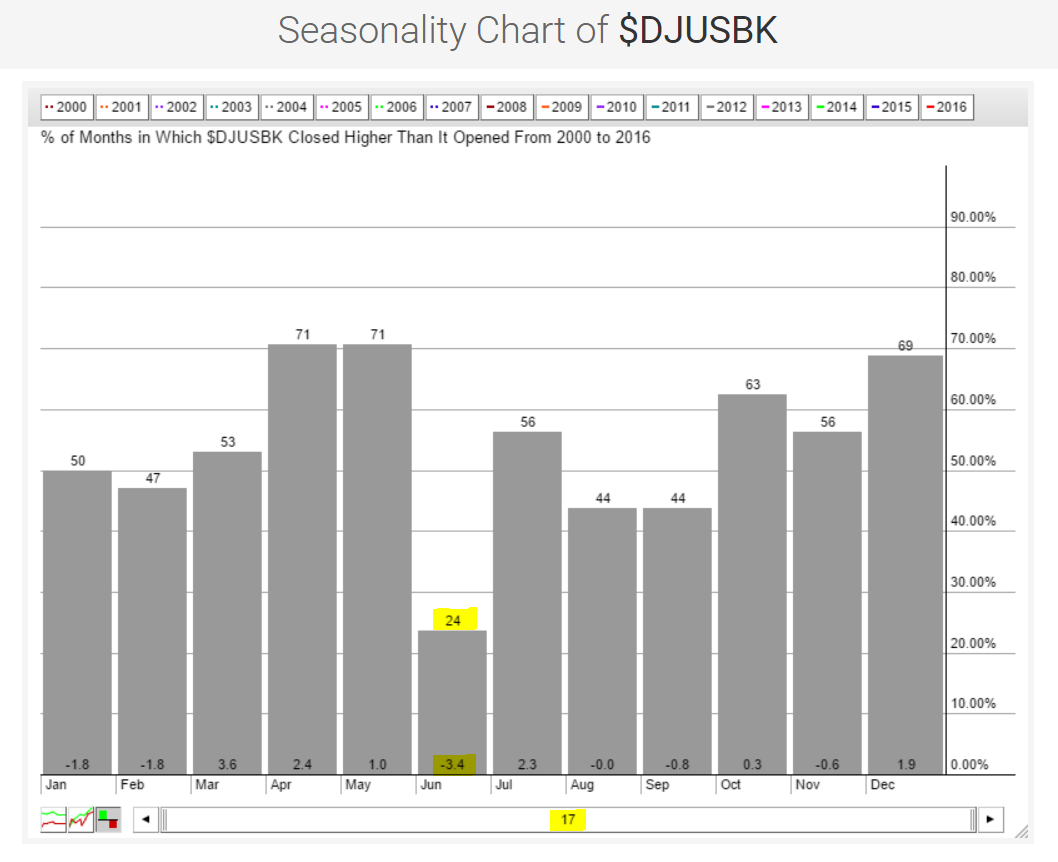 January and February are both weak with average monthly losses of 1.8%, but June has clearly been the worst month and we still have another half of June to go. Knowing the seasonality makes those key support levels very critical to hold.
Key Earnings Reports
None
Key Economic Reports
May retail sales released at 8:30am EST: +0.5% (actual) vs. +0.3% (estimate)
May retail sales less autos released at 8:30am eST: +0.4% (actual) vs. +0.4% (estimate)
April business inventories to be released at 10:00am EST: +0.2% (estimate)
Happy trading!
Tom


