Market Recap for Thursday, June 16, 2016
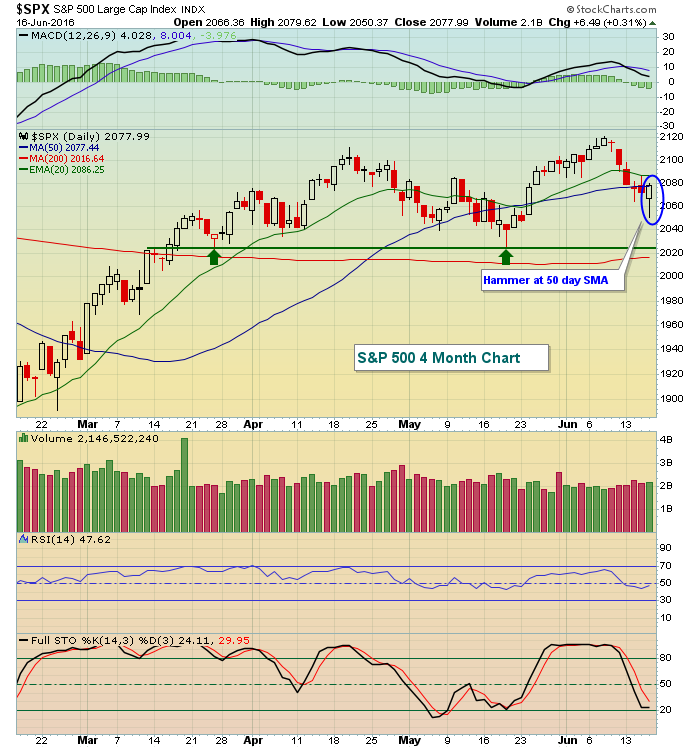
Okay, this really is getting old. Early in the session, it appeared as if the U.S. would follow the lead of global markets and sell....and sell....and sell. Volatility ($VIX) hit an intraday high of nearly 23, its highest level since February 19th. That set the stage for impulsive bouts of selling to potentially take the S&P 500 much, much lower. But after falling more than 1% intraday, the S&P 500 rallied and finished higher by 6 points, printing a hammer and closing just above its 50 day SMA. On the surface, it was very impressive action. Take a look:
 No doubt it was an impressive rally off early lows. But.....once again leadership came in the form of defensive stocks. Look at the top four sectors:
Utilities (XLU): +0.63%
Consumer staples (XLP): +0.52%
Healthcare (XLV): +0.35%
Materials (XLB): +0.34%
That is just not impressive and gives us much more insight into what's taking place under the surface.
Energy (XLE, -0.48%) fell on Thursday and was the only sector in negative territory as crude oil prices ($WTIC) were down more than 3%.
Pre-Market Action
Global markets are relieved that the benchmark S&P 500 was able to stop the global selloff on Thursday and that's paved the way for modest gains this morning. In particular, the German DAX ($DAX) held critical price support near 9500 yesterday and is trading closer to 9600 this morning. Another drop to close below 9500 would be bearish for the S&P 500 because of its strong positive correlation to the DAX.
At last check, Dow Jones futures were lower by 20 points.
Current Outlook
Energy has been leading the S&P 500 higher in 2016, but it's struggled in the past few sessions. Yesterday's candle suggests a possible short-term bottom as you can see below:
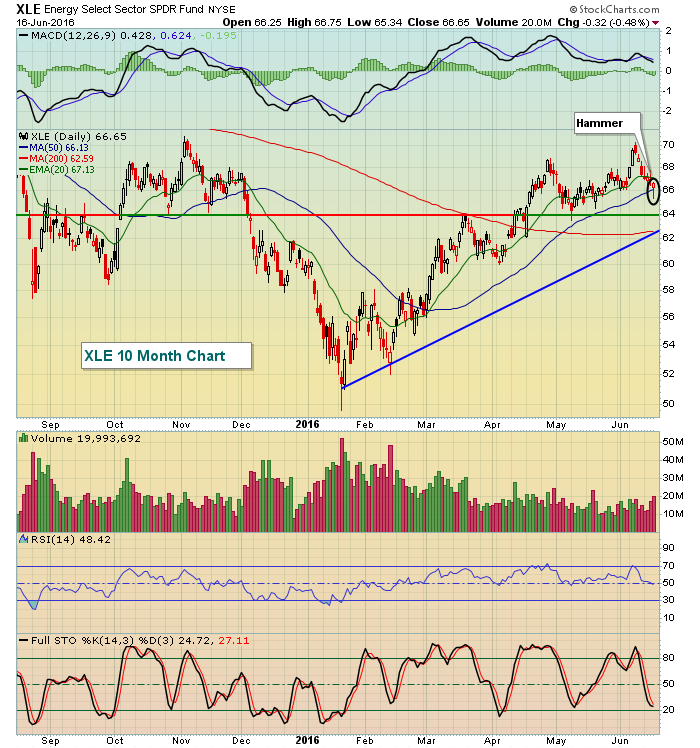 The good news is that we should see higher XLE prices today off that reversing candle. The bad news is that next week is historically bearish and many other technical signs are pointing to a selloff. The blue trendline will be important support in the intermediate-term, along with the price support close to 64.
Sector/Industry Watch
The performance of transportation stocks, relative to utilities, is approaching the low set back in February. So it's clear that while the S&P 500 remains close to an all-time high close, the rotation suggests that traders are preparing for a top, not the next leg higher in a bull market. Check this out:
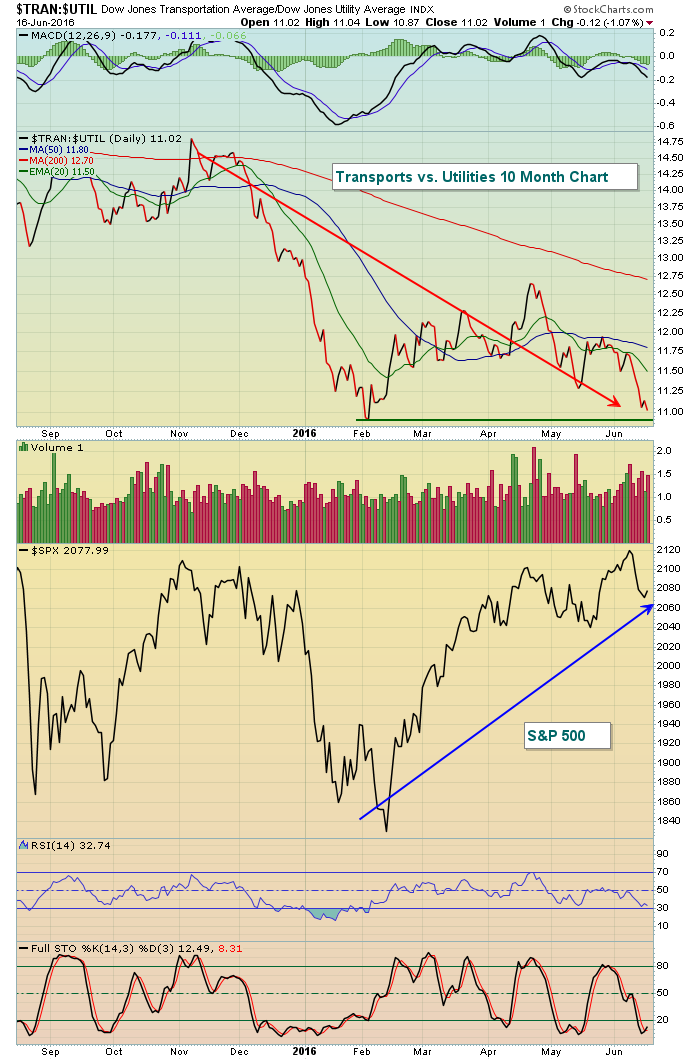 While the S&P 500 is very close to where it was in early November, the rotation away from transport stocks and into utilities is quite obvious with that relative ratio (TRAN:UTIL) free-falling. In my view, this is a huge warning sign but thus far the bulls have managed to escape with little weakness in the benchmark S&P 500. Will that continue? I don't think so, but we'll see.
Historical Tendencies
The NASDAQ will end its current historical bullish period at the close today and begin a rather weak historical period that lasts through June 26th. From June 18th to June 26th, the annualized return on the NASDAQ (since 1971) is -23.52%.
Key Earnings Reports
None
Key Economic Reports
Housing starts to be released at 8:30am EST: 1,150,000 (estimate)
Building permits to be released at 8:30am EST: 1,140,000 (estimate)
Happy trading!
Tom


