Market Recap for Friday, June 17, 2016
It was more of the same on Friday. Our major indices fell despite a rally that took place late in the morning session. Early losses were cut, but overall the bulls weren't able to totally recover from the morning weakness. The bottom of the sector leaderboard was littered with aggressive areas, including healthcare (XLV, -1.04%) and technology (XLK, -0.67%). Biotechnology ($DJUSBT) was the primary culprit for the weakness in healthcare as this influential group dropped 1.66%. Internet stocks ($DJUSNS) led the weakness in technology, losing 1.90%. Alphabet (GOOGL) fell 2.76% to threaten a key price support level as reflected below:
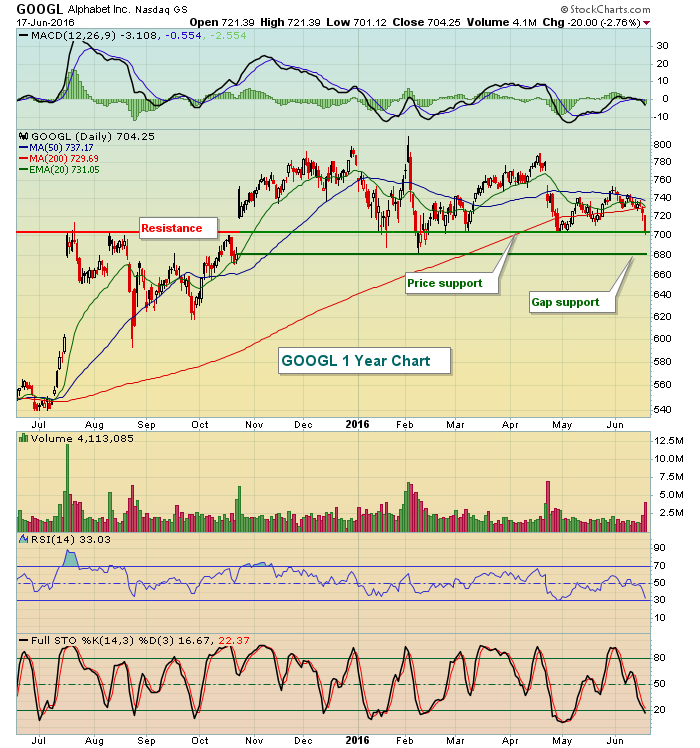 GOOGL is at the first of two key support levels - one price support that was established on the breakout last October and the other gap support from the earnings-related gap higher that same day in October. 680-700 is what I would consider critical support.
Overall, internet stocks are facing a key test of their own. Check out the Sector/Industry Watch section below for more details.
Energy (XLE, +1.02%) has rebounded beautifully in the near-term after printing a bullish reversing hammer on the 50 day SMA last Thursday. Friday's gain was important technically as price support was nearly tested as well. Check out the recent action in the XLE:
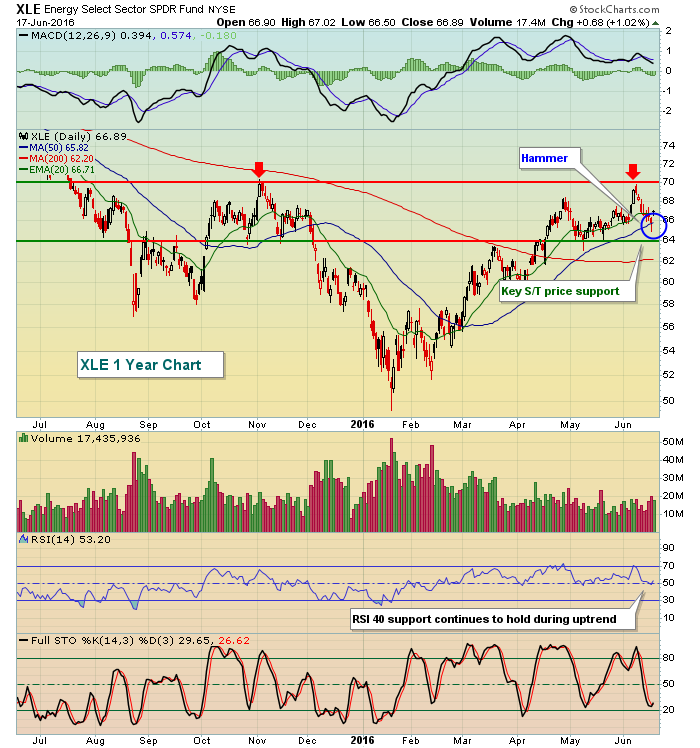 The red arrows mark key price resistance while 64 should offer up nice support in the near-term for the bulls.
Pre-Market Action
There is little news to trade off of here in the U.S. this morning as there are no key earnings or economic reports. Yet, Dow Jones futures are surging on the Brexit polls over the weekend that suggest the "remain" camp has gained and is leading the "leave" camp with respect to the European Union. These potential opening gains follows global gains overnight in Asia and this morning in Europe.
Crude oil ($WTIC) is also strong this morning, gaining more than 2% so the bulls will have plenty of optimism when the opening bell rings. The question will be whether initial key areas of resistance can be cleared on the close today. For more on that, check out the Current Outlook section below.
Current Outlook
It appeared the bulls were in trouble and needing respiratory help last week until Thursday's reversal. Thus far, the intraday lows on Thursday are holding across all of our major indices. That's the support to watch and the pre-market action is suggesting that the bulls will have plenty of wiggle room when the action gets started this morning. But what are the key levels to watch in terms of resistance? Well, on the S&P 500, I'd watch the following:
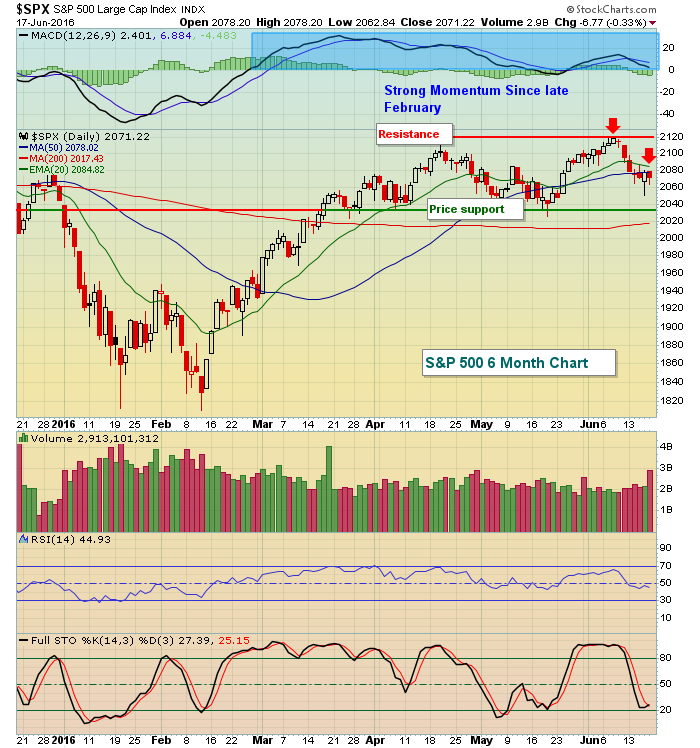 The two red arrows are the resistance levels I'd keep a close eye on. First, the 20 day EMA has turned lower and during downtrends, that moving average tends to market key short-term resistance. So failure there on today's close, with a reversing candle, would be short-term bearish while a close above would provide an opportunity to challenge the 2120 level again. And let's not forget the all-time high close on the S&P 500 is 2131 - that's the ultimate resistance.
Sector/Industry Watch
Internet stocks ($DJUSNS) are a very aggressive area within technology and is a favorite area of mine. Given the GOOGL weakness reflected above in the Market Recap section, it's very important for the DJUSNS to hold onto its 200 day SMA. Note the number of times that the DJUSNS has successfully bounced off this support area:
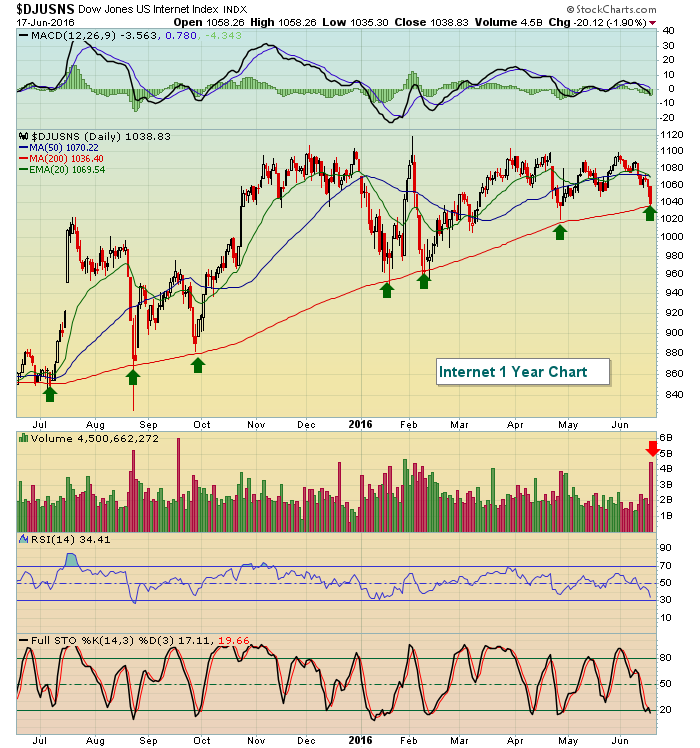 While I don't follow the 200 day SMA that closely, it's very apparent that many traders do as each time we've tested this rising moving average support, GOOGL has bounced. On Friday, this 200 day SMA was tested again. I'd expect another bounce. Volume did accelerate quite noticeably on Friday, however, so if this moving average is lost, buyer beware.
Historical Tendencies
Mondays have historically been the weakest calendar day of the week BY FAR on the S&P 500 since 1950. Mondays that fall during the bearish 18th through 27th of the calendar month have been particularly weak. Today, however, the open looks to be very bullish. It'll be interesting to see if the bulls can build on these opening gains.
Key Earnings Reports
None
Key Economic Reports
None
Happy trading!
Tom


