Market Recap for Wednesday, June 8, 2016
Our major indices pushed higher once again on Wednesday with the S&P 500 climbing within 12 points of its all-time high close of 2131. But the strongest index was clearly the small cap index, or Russell 2000, which gained 0.76% and is nearing a price level not seen since late 2015. It's important to see leadership from small caps relative to the S&P 500 as it demonstrates traders' willingness to take risks. Check out the absolute and relative performance of the Russell 2000 over the past year:
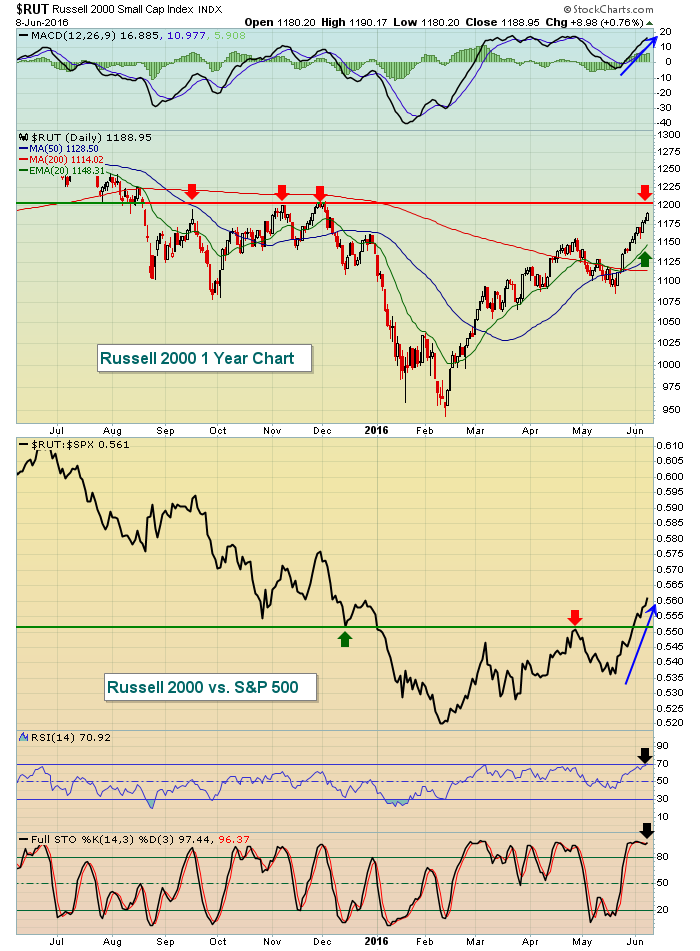 There's still more room to the upside on the Russell 2000 before it hits price resistance (horizontal red line and red arrows), but keep in mind that RSI is now at 71 and stochastic is 97 (black arrows). That combination suggests that small caps are very overbought and could use a little profit taking near-term. Based on the Historical Tendencies posted in yesterday's blog, this is also the time during June when the U.S. stock market tends to put on the brakes.
The relative strength in the Russell 2000 (shown below the RUT's price chart above, "RUT:SPX") is rising too, indicative of small caps being in favor among traders. That's important because companies in the Russell 2000 do most of their business in the U.S. So when the relative strength is rising, it's typically represents a belief that the U.S. economy will strengthen in the weeks and months ahead.
Railroads ($DJUSRR) were very strong on Wednesday, leading industrials (XLI, +0.63%) to the top of the sector leaderboard. Heavy construction ($DJUSHV) rose 1.12% yesterday to add to the strength in industrials and they've become a very strong group. They're featured below in the Sector/Industry Watch section below.
Pre-Market Action
Global markets were weak overnight in Asia and that weakness is carrying over to Europe. The German DAX has been volatile and today the bears are in charge. The DAX is down 1.41% at last check. Key price resistance is a problem here in the U.S. as our major indices, especially the S&P 500, near critical levels. Crude oil ($WTIC) has had a stellar run thus far in 2016, but oil is down over 1% this morning, contributing to the early selling.
Initial jobless claims came in this morning better than expected and JM Smucker (SJM) posted solid results and guidance, but that, along with a LinkedIn (LNKD) upgrade has done little to stem the tide of selling this morning. I wouldn't be surprised to see more selling throughout the session.
Current Outlook
The futures turning red today maybe shouldn't be that big of a surprise if you consider that the Volatility Index ($VIX) has been rising the past couple days while the market has moved higher. Normally the opposite occurs with complacency setting in as prices rise. Check out the divergence in the S&P 500 vs. the VIX on this very short-term intraday chart:
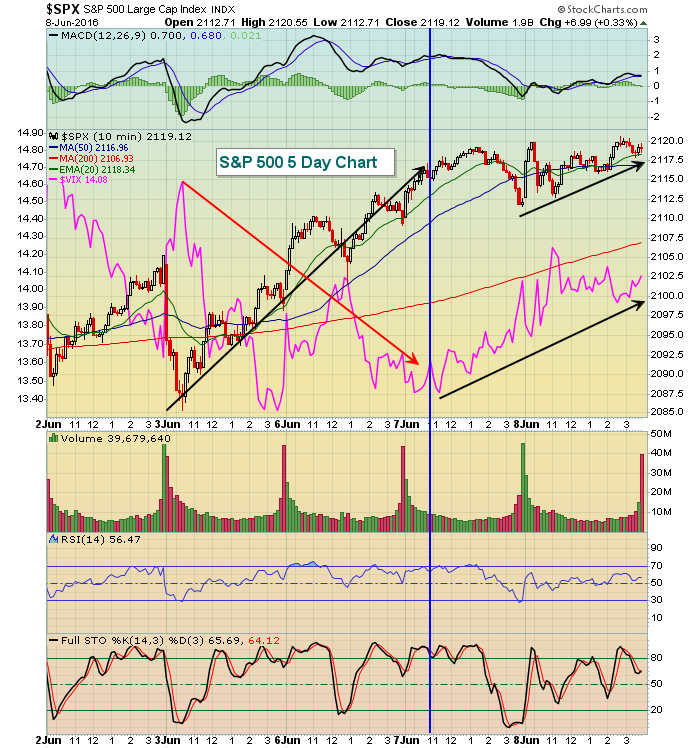 Prior to the blue vertical line, the relationship between the S&P 500 and the VIX (pink line) seemed inverse and normal. But look at the last two days. As the S&P 500 continues to push higher, the rise in the VIX is a signal that the market may be turning more cautious. We're very close to resistance on a number of key indices so profit taking from current price levels would make sense and the VIX appears to be providing us a warning sign near-term.
Sector/Industry Watch
The heavy construction chart was under repair for many months, but recently the group surged, breaking its downtrend and establishing itself as a group to own. That strength continued yesterday and there are many positive technical attributes to consider. Check it out:
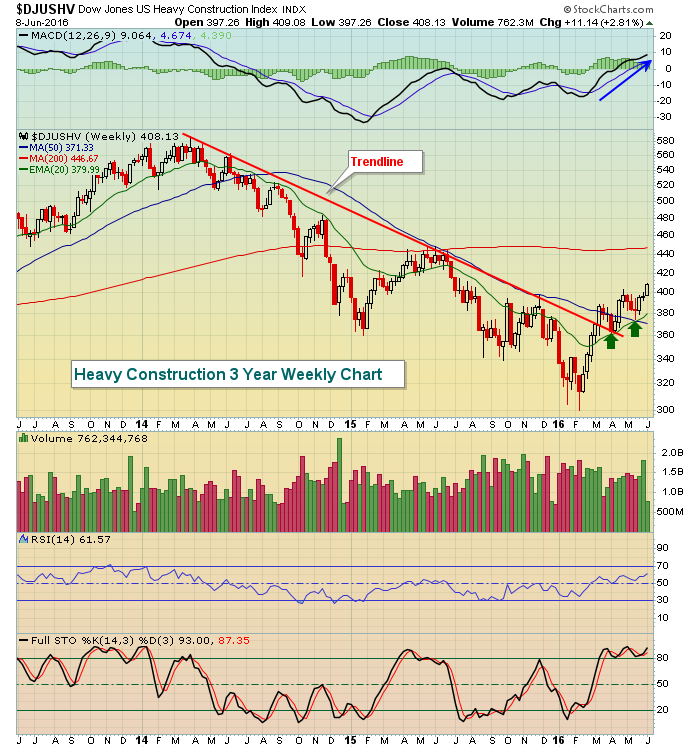 The downtrend has broken and prices are now stair-stepping higher. It's quite bullish to see the rising 20 week EMA providing support during bouts of selling. Look for that to continue as the weekly MACD is strengthening above its centerline.
Historical Tendencies
As far as calendar days go, the 9th of all calendar months cumulatively is the 2nd worst day of the month, trailing only the horrific -34.33% annualized performance of the 19th. The annualized loss on the 9th: -19.74%. These stats relate to the S&P 500 since 1950.
Key Earnings Reports
(actual vs. estimate):
SJM: 1.86 vs 1.19
(reports after close, estimate provided):
HRB: 3.03
Key Economic Reports
Initial jobless claims released at 8:30am EST: 264,000 (actual) vs. 270,000 (estimate)
April wholesale trade to be released at 10:00am EST: +0.1% (estimate)
Happy trading!
Tom


