Market Recap for Tuesday, June 7, 2016
The benchmark S&P 500 closed at 2109.41 on Monday, it's highest close since November 3, 2015 when it finished at 2109.79. This finish is just 1% away from its all-time high close of 2130.82 on May 21, 2015. Energy (XLE, +2.21%) and materials (XLB, +1.03%) resumed their leadership roles. Crude oil ($WTIC) hasn't closed above $50 per barrel since July 2015, but Monday's close of $49.71 is certainly getting close. A breakout in crude oil above $50 per barrel would likely trigger the next leg higher in the XLE and create another relative breakout in the XLE vs. the S&P 500. Check out yesterday's solid gain in the XLE and the current relative strength:
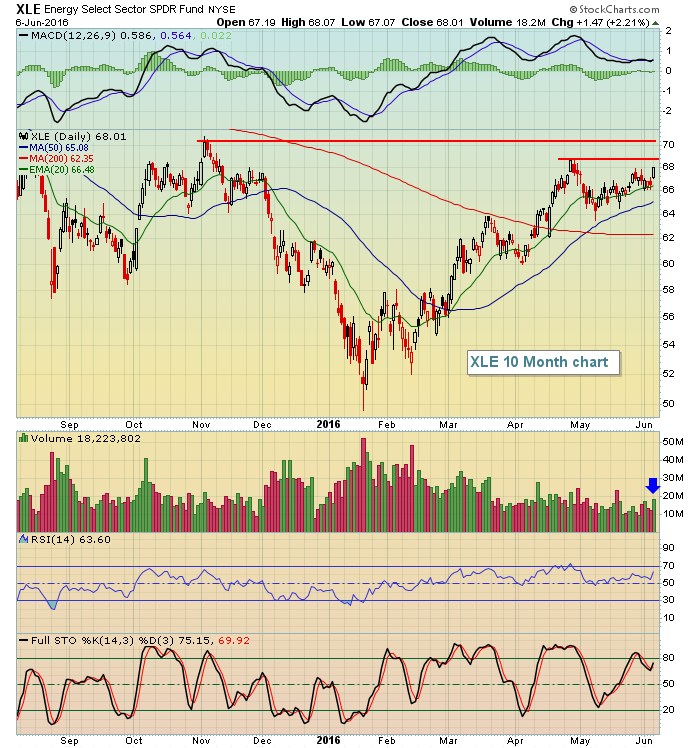 At the last high on the XLE in late April, note that the RSI had climbed above 70 and stochastic was in the 90s. The energy space was very overbought and needed relief. The month of May provided that with the RSI dipping back into the 40s and stochastic dropping to 20. From there, the XLE began its ascent again. I believe energy continues to be a sector where you want exposure and is likely to test price resistance as indicated by the two red horizontal lines above.
Materials (XLE) broke out with its strength on Monday and is being featured below in the Sector/Industry Watch section below.
The 10 year treasury yield ($TNX) is consolidating just above 1.70% yield support and that pause to the downside provided utility (XLU, -0.14%) longs a reason to take profits. The XLU was the only sector ETF to finish lower on Monday.
Pre-Market Action
Global markets were strong overnight and continue to be this morning. Fed Chair Janet Yellen provided a boost to equities when she said that the fed funds rate should gradually rise as economic conditions continue to improve. Traders likely zeroed in on the word "gradual", suggesting that the Fed will remain accommodative in the foreseeable future.
U.S. futures are higher with the Dow Jones looking to open up by perhaps 40 points. The German DAX ($DAX) currently sports a 1.65% gain this morning and the S&P 500 has a history of tracking alongside this European index. Accordingly, I'd expect to see the S&P 500 perform well today, barring a sudden reversal in the DAX.
Current Outlook
Looking at the S&P 500, we're not yet overbought despite the consistent gains over the past couple weeks. A steady climb in prices tends to send stochastic into overbought territory, which is the case currently. The stochastic reading on the S&P 500 is currently 96. But the RSI is only 63 and hasn't hit 70 since the S&P 500 hit an intraday high on April 20th at 2111. Now that the S&P 500 has returned to this level, it's done so with room to the upside on its RSI and a strengthening daily MACD. Focusing on the shorter-term 60 minute chart, the MACD also is just turning up after a recent negative divergence played out. In other words, short-term momentum is poised for further gains, as is daily momentum. All of this suggests the S&P 500 has a better-than-average chance to test its all-time high close of 2131 before we'll need to re-evaluate. Here's the 60 minute chart:
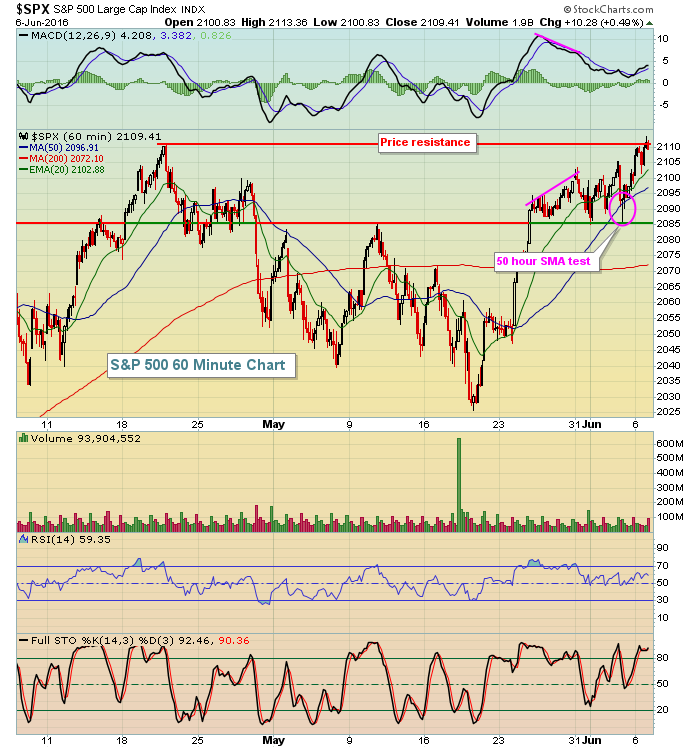 The pink lines and circle illustrate what I look for when a negative divergence prints - a trip back to test the rising 50 period SMA. But the 60 minute MACD is beginning to gain strength once again and that provides a better opportunity for a short-term breakout above resistance.
Sector/Industry Watch
Basic materials (XLB) broke out on Monday to a fresh new closing high. The sudden weakness in the U.S. dollar ($USD) after the dismal jobs report on Friday has definitely been a contributing factor, but strength in aluminum ($DJUSAL), platinum & precious metals ($DJUSPT) and steel ($DJUSST) all have prompted the sector ETF to forge to new highs. Here's the latest technical outlook on the XLB:
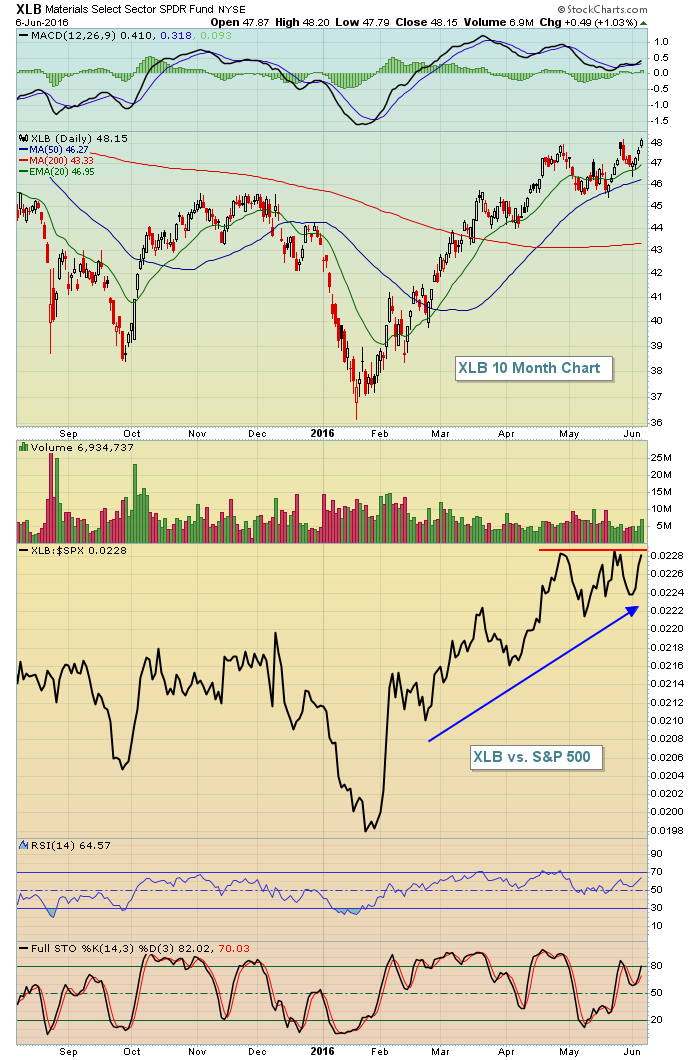 Like energy, materials are performing very well on a relative basis and exposure to this group - so long as the relative strength continues - is a must.
Historical Tendencies
After a strong 10 day bullish historical period that just ended, the S&P 500 tends to see profit taking over the next few calendar days. Here are the annualized returns on the S&P 500 (since 1950) for each of the following days:
June 7 (today): -5.08%
June 8 (Wednesday): -29.03%
June 9 (Thursday): -53.26%
Historical weakness from the 7th to the 10th day of the calendar month has been the norm in the U.S. stock market for many years.
Key Earnings Reports
(reports after close, estimate provided):
PAY: .44
Key Economic Reports
Q1 productivity released at 8:30am EST: -0.6% (actual) vs. -0.6% (estimate)
Happy trading!
Tom


