Market Recap for Thursday, June 23, 2016
The Britons have voted and it's to exit the European Union. It's almost pointless to discuss what happened yesterday because any gains from Thursday will likely be long gone at the open this morning, unless you're holding gold (GLD), which is soaring more than 5% on the Brexit result. But let's go ahead and spend a few minutes to summarize yesterday's action.
First, it was clear that global markets were expecting a different result with the Brexit vote. All of our major indices were much higher with the aggressive Russell 2000 index up more than 2% in anticipation. Banks ($DJUSBK) were a notable winner, bouncing off key 290 support as financials (XLF, +2.10%) led the market advance. Here's the most recent technical outlook for banks:
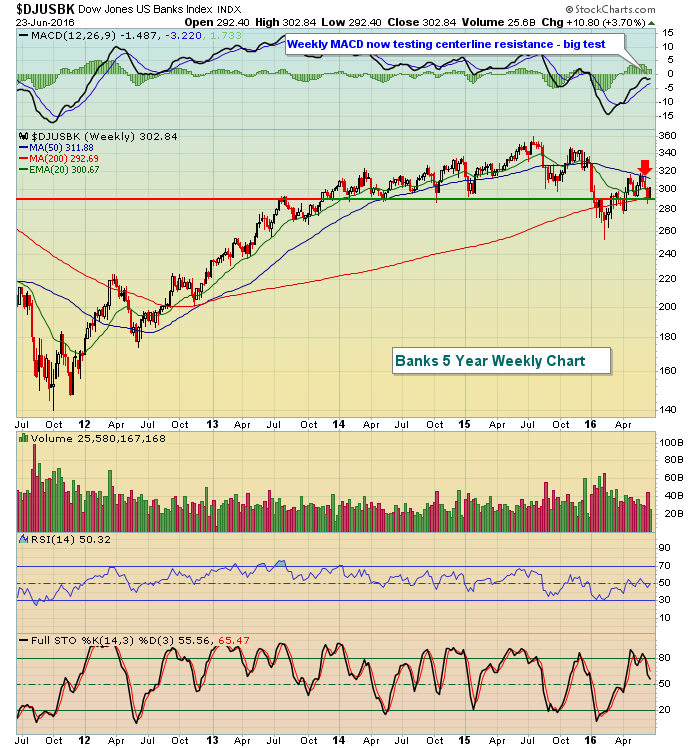 While the 290 level has been a key pivot area for the DJUSBK and Thursday's bounce was important, you can see from the above chart that banks have much more work to do. The weekly MACD has yet to clear centerline resistance and the latest failure at 50 week SMA resistance is also obvious and bearish. Banks really won't be technically healthy in the longer-term until both MACD centerline and its 50 week SMA are cleared.
All nine sectors were higher on Thursday, with defensive sectors lagging. That's bullish action, but it was difficult being long into the Brexit vote and futures are proving why.
Pre-Market Action
Given the high volatility index, futures are acting about the way I would expect given the disappointing Brexit results. I say "disappointing" because Wall Street and global markets are disappointed and selling on the news. Time will tell what kind of impact will be seen from the UK withdrawing from the EU. It will take many months, perhaps years, to understand the full effect. But, as traders, we need to respect the technical price action, which clearly will be bearish here in the U.S. at today's opening bell.
Dow Jones futures are down a staggering 500 points. If that holds into the open, while the loss is dramatic, we'll simply be back where we were one week ago.
The 10 year treasury yield ($TNX) has fallen 19 basis points in what is one of the largest declines in the TNX that I've witnessed. Clearly, the bond market is sending a message loud and clear that Brexit will have a detrimental impact in terms of the U.S. economy. Again, we need to respect that until a different message is sent.
Gold ($GOLD) is soaring on the vote, up $68 per ounce to $1333 at last check. That's the highest level in gold since mid-2014.
Current Outlook
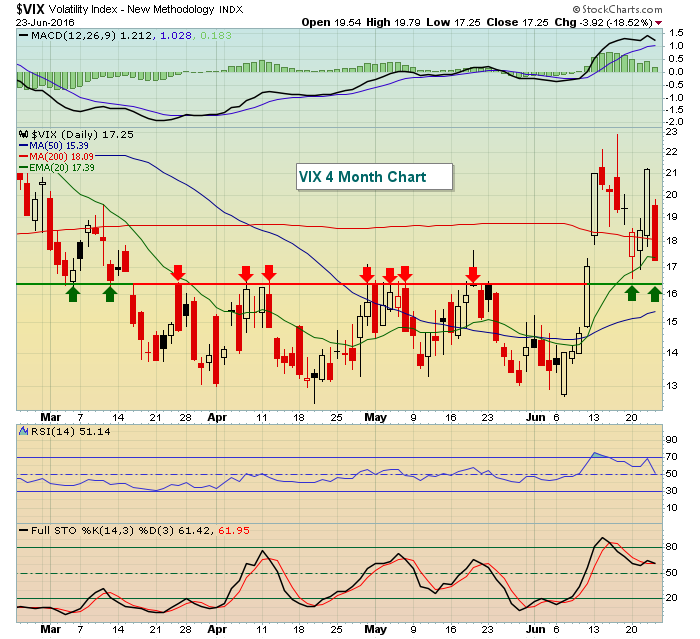
The Volatility Index ($VIX) tumbled 18.52% on Thursday, but it remained above its key 16.50-17.00 support and, as mentioned previously, that's a warning sign that we have to respect. The reason? An elevated VIX tells us that market conditions are ripe for a sell off as market participants are anticipating high volatility. High volatility is almost always associated with stock market weakness. That's historically when impulsive selling tends to kick in. We're going to see that impulsive selling at today's open. A chart to highlight 16.50-17.00 support is provided below:
 A VIX remaining above 16-17 has been historically important to sustain bear markets. Check out the longer-term weekly chart of the S&P 500 with the VIX below:
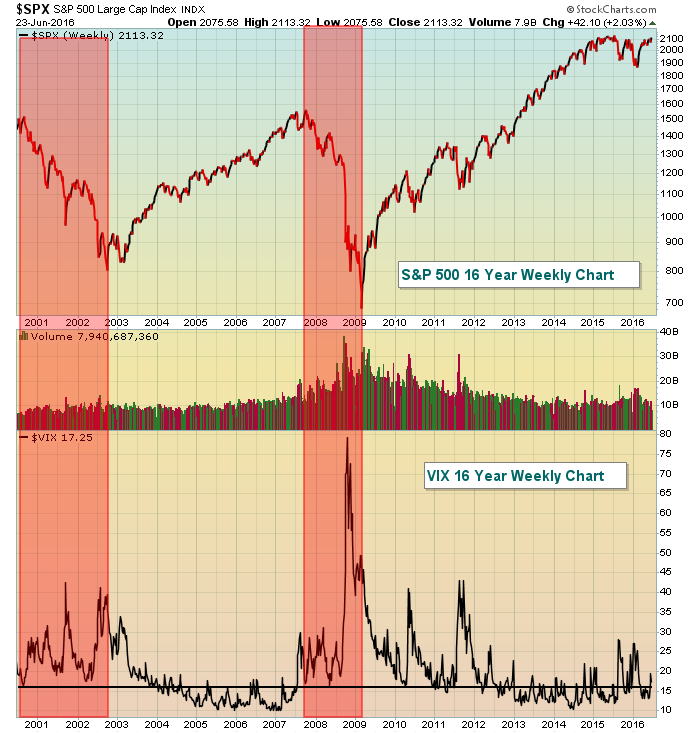 The red highlighted areas above show that the VIX never moved below 16 during the two prior bear markets. So as long as the VIX is elevated and above 16, we should respect the "possibility" that we could be at the start of a bear market. Should the VIX move back below 16, the odds of a bear market diminish considerably.
Sector/Industry Watch
Crude oil prices ($WTIC) are down more than 4% this morning after the surprising Brexit results. The good news is that the WTIC has not lost key price support as reflected below:
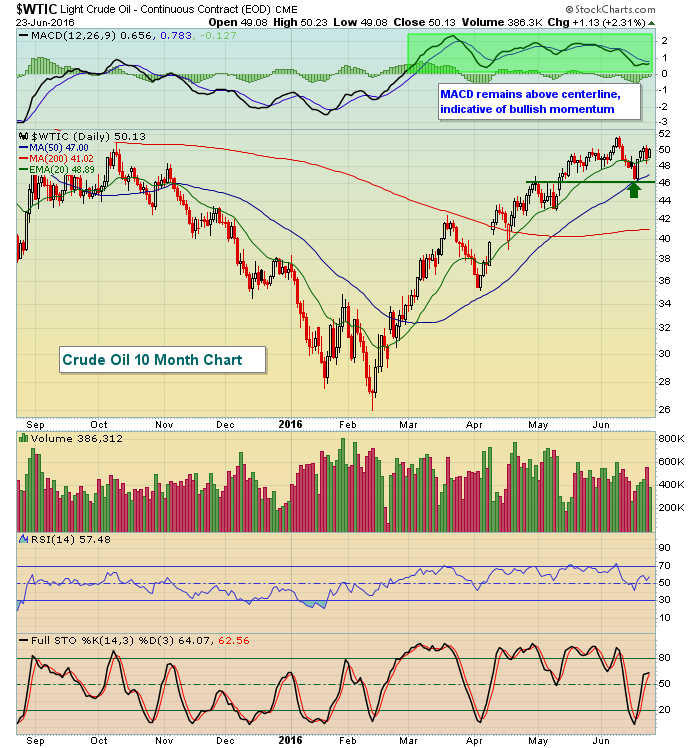 The first critical support area, in my view, is near $46 per barrel. This morning, crude oil still trades above $47 per barrel. Crude oil prices are another reflection of what market participants see in the months ahead in terms of economic activity. Therefore, we don't want to see the uptrend off the February lows broken.
Historical Tendencies
Today marks the end of the bearish historical period that runs from June 18th to June 26th. June 27th (Monday) begins a fairly strong historical period that runs through July 17th. July 11th through July 17th is the strongest part of that bullish period. The NASDAQ, for instance, has produced annualized returns of 60.22% during this seven calendar day period since 1971.
Key Earnings Reports
None
Key Economic Reports
May durable goods released at 8:30am EST: -2.2% (actual) vs. -0.7% (estimate)
May durable goods ex-transports released at 8:30am EST: -0.3% (actual) vs. +0.0% (estimate)
Happy trading!
Tom


