Market Recap for Tuesday, June 14, 2016
It was more of the same on Tuesday. Most of the selling took place in the first hour and then our major indices rallied. The problem, once again, was that leadership came in the form of utilities (XLU, +0.53%) and consumer staples (XLP, +0.39%) - two defensive groups. Money rotating towards defense has been the theme for many months. The 10 year treasury yield ($TNX) nearly touched the support mentioned yesterday when it hit its intraday low of 1.57%. Check out the chart:
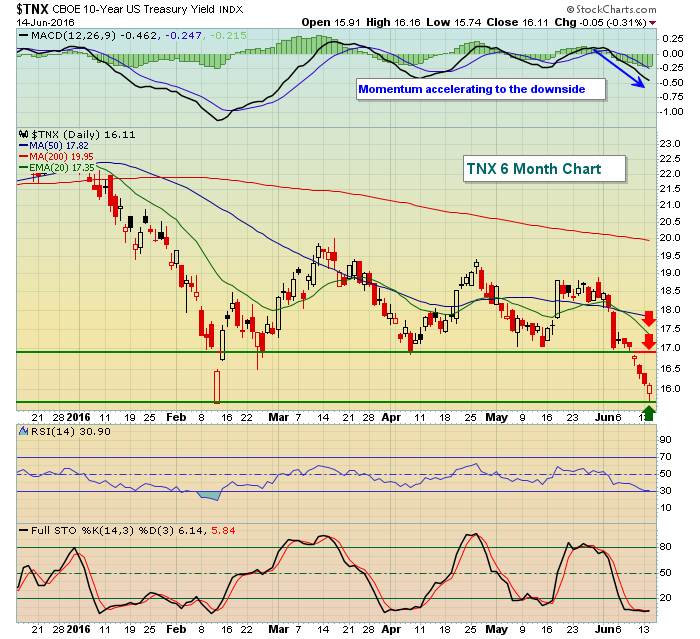 The green arrow marks very significant yield support. The red arrows mark two key areas of short-term yield resistance. The interesting part is that Fed Chair Janet Yellen will announce the latest Fed policy decision at 2pm EST today. Despite the most recent lackluster jobs report - the worst in six years - I fully expect the Fed to communicate how wonderfully blue the skies are ahead and that the Fed expects to raise rates again later this year. In the past 2-3 weeks, the bond market is not buying any of that rhetoric and the proof is in the yield, dropping from nearly 1.90% to under 1.60% during that span.
The falling yields are killing certain areas of financials (XLF, -1.48%) with banks ($DJUSBK) nearing a very critical 290 level. Life insurance ($DJUSIL) lost price support at 600 and is highlighted below in the Sector/Industry Watch section.
Special Note:
I will be hosting my usual Trading Places LIVE webinar later today at noon EST and I'll be discussing much of what's in today's blog article in more detail. Please join me if you can. CLICK HERE to register.
Also, if you're new to my blog, go to the bottom of this article and "subscribe" by clicking "yes" to the question about whether you'd like to receive e-mail notifications. Thank you for your support!
Pre-Market Action
The German DAX is bouncing this morning off very significant intermediate-term price support at 9500. The S&P 500 and the DAX tend to move together so I'm watching the 9500 level on the DAX very closely. Visually, take a look:
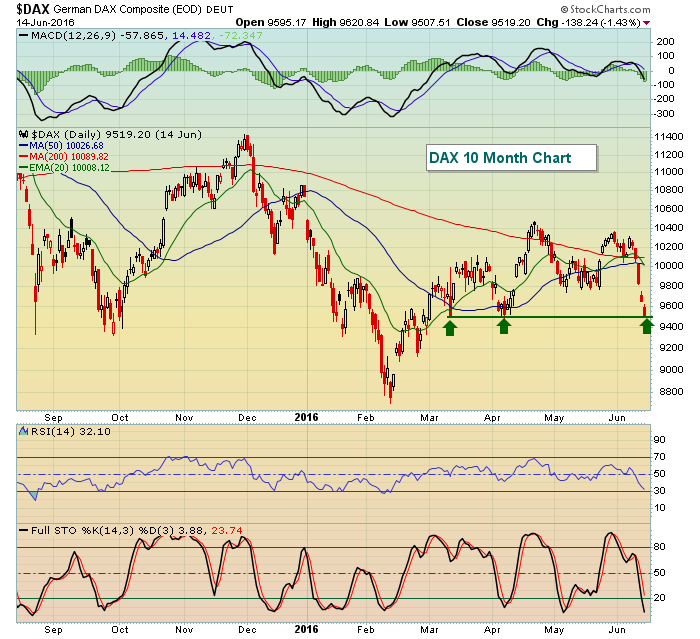 We're seeing strength this morning in most global markets, but honestly it appears to be more of an oversold bounce after the past several sessions of selling in many markets.
The 10 year treasury yield ($TNX) is up slightly this morning as the selling of treasuries on Fed Day has created a bit of demand for U.S. stocks. Dow Jones futures were up 40 at last check.
Make no mistake about it though, all eyes are on the Fed this afternoon. Let's see how the market reacts and go from there.
Current Outlook
History tells us we should expect a bounce here. Technically, the S&P 500 reversed yesterday to hold its 50 day SMA at the close. The Russell 2000 also bounced to barely close beneath its rising 20 day EMA. The Dow Jones and NASDAQ both appear to be weakening a bit more. I have to believe the Fed will say whatever it needs to in order to keep the stock market afloat. Volatility is rising and above critical price levels (17 technically in the short-term and 20 historically). If the Fed were to drop a bomb on the market this afternoon, I don't believe the stock market would handle it well. So the bulls are hoping the same "strengthening economy" rhetoric will be told later today and that both the bond and stock markets buy into it - at least in the short-term. One problem lately has been that the bond market is NOT buying it and sees little chance of a rate hike in the foreseeable future.
Here's a look at the most bullish of our major indices, the Russell 2000:
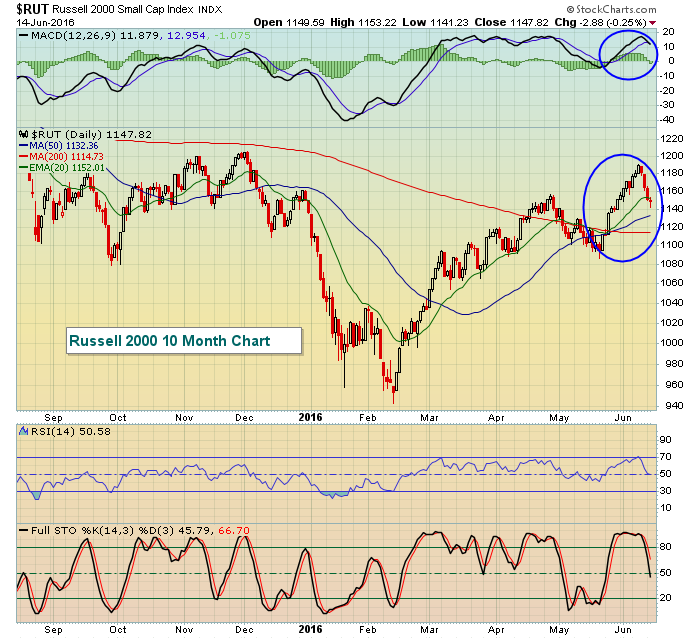 The strong MACD suggests accelerating bullish momentum on the most recent price high. Typically, pullbacks from such highs find support at the rising 20 day EMA. One problem, however, is that the Russell 2000 is the only of our major indices that looks bullish. The others are neutral at best and we know money continues rotating very defensively.
On the S&P 500, the 2025-2050 support zone is critical. Given the accelerating volatility, or fear, the absolute last thing you want to see is recent price support lost, especially when that support zone resides beneath all key moving averages. On the NASDAQ the 4810-4820 has been a key area of support over the past couple months, initially created by the gap lower on May 3rd from 4817.
Sector/Industry Watch
Life insurance ($DJUSIL) tends to suffer with falling interest rates, very similar to banks. The following chart shows the technical breakdown below 600 on the DJUSIL. Also, note the moving averages circled in blue. Yesterday's close ended beneath all three, not a good sign technically. So life insurance is one industry group that will be looking for a negative reaction in the bond market (ie, selloff in treasury prices and corresponding rise in the TNX). Here's the chart:
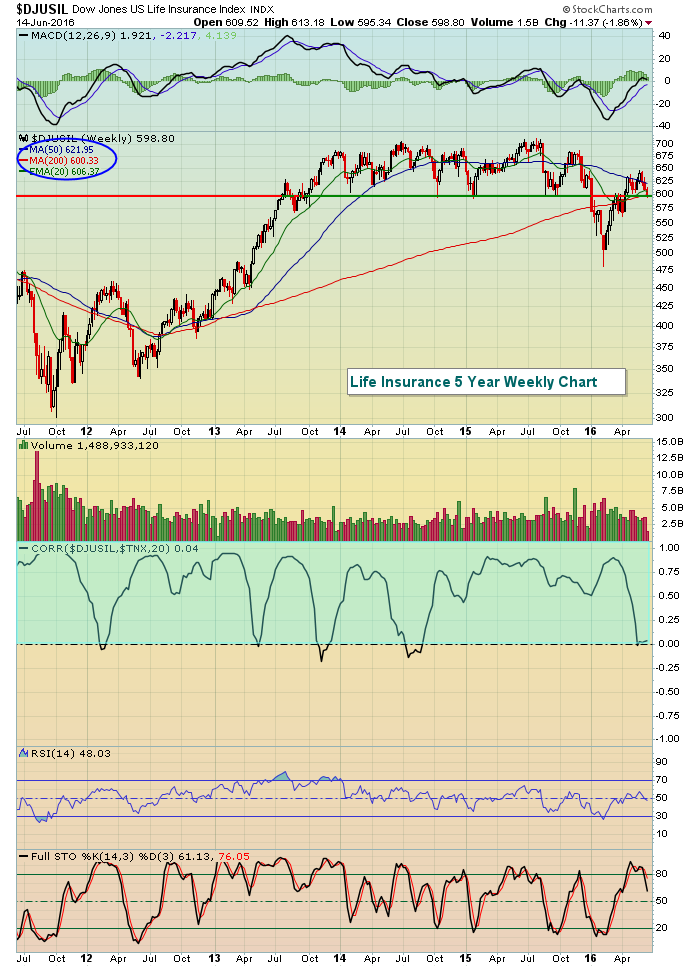 The blue shaded area shows that the correlation between the DJUSIL and the TNX is a very strong positive one. In other words, the DJUSIL tends to follow the direction of the 10 year treasury yield. This is a group that could been heavily impacted by today's 2pm EST FOMC policy statement.
Historical Tendencies
The Russell 2000 is hitting key 20 day EMA support with a strong MACD as reflected above in the Current Outlook section. That would suggest a decent chance for a short-term bounce. That likelihood is enhanced by the historical performance of the Russell 2000 over the next three calendar days. The following represent annualized returns on the Russell 2000 since 1987 for each of the following days:
June 15 (today): +66.32%
June 16 (Thursday): +60.19%
June 17 (Friday): +36.21%
Key Earnings Reports
(reports after close, estimate provided):
CTRP: (.67)
JBL: .05
KFY: .54
Key Economic Reports
May PPI released at 8:30am EST: +0.4% (actual) vs. +0.3% (estimate)
May Core PPI released at 8:30am EST: +0.3% (actual) vs. +0.2% (estimate)
June empire state manufacturing survey released at 8:30am EST: 6.01 (actual) vs. -3.50 (estimate)
May industrial production to be released at 9:15am EST: -0.1% (estimate)
May capacity utilization to be released at 9:15am ESt: 75.2% (estimate)
Happy trading!
Tom


