Market Recap for Thursday, July 21, 2016
Aggressive sectors took a break on Thursday, as did the overall market. The S&P 500 saw its most intraday weakness since breaking out above 2131 to all-time highs more than a week ago. Technically, however, there was little damage done. In fact, it certainly could be argued that the selling was necessary to unwind 60 minute negative divergences and to reset its 60 minute MACD. Have a look:
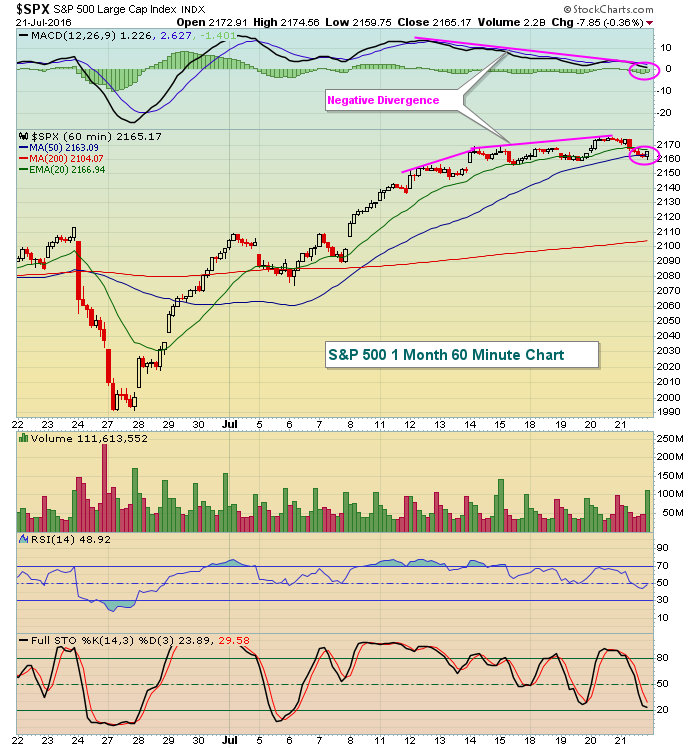 The pink circles above show the hourly MACD just about touching centerline support and Thursday's late day rally occurred from the 50 hour SMA - both of these technical developments are bullish from a price perspective.
Another problem faced by the bulls was the resistance on the Russell 2000. Small cap stocks have had a pivot area from 1200-1225 for the past few years so it's not too surprising to see the Russell 2000 stall in this area. A break above 1225 would be very bullish for one of the most aggressive U.S. indices. Check out the significance of the 1200-1225 zone:
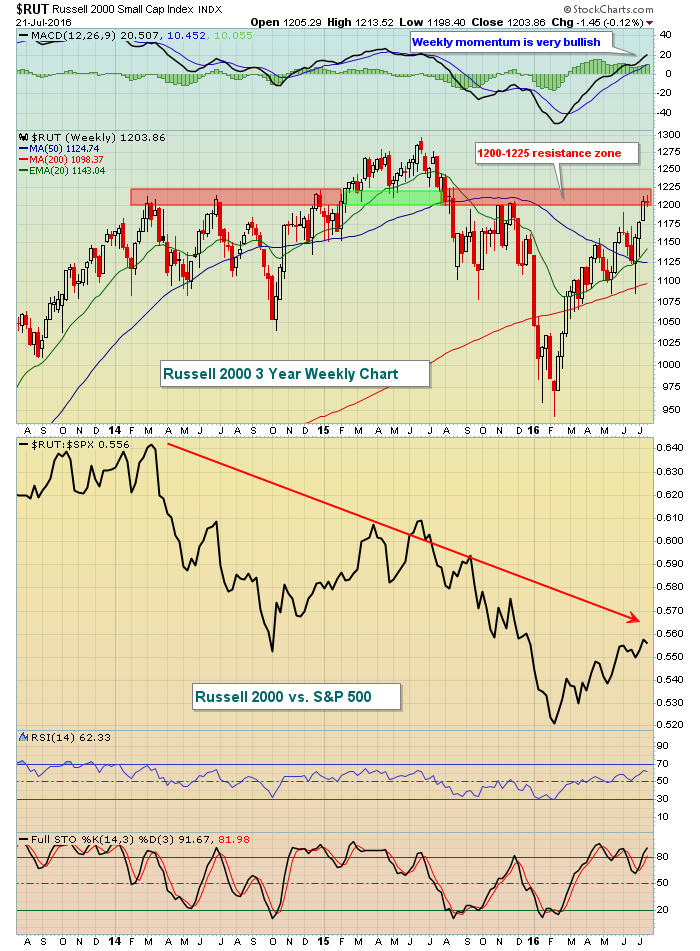 In addition to clearing the resistance zone identified above, I want to see the relative strength line ($RUT:$SPX) continue to strengthen as well. History is a great teacher and stock market advances can be trusted much more when aggressive areas like small caps are leading on a relative basis.
Utilities (XLU, +.60%) were back on top of the sector leaderboard as this defensive sector found support and bounced off its 20 day EMA. Healthcare (XLV, +0.29%) also were strong on a relative basis as biotechs ($DJUSBT) further strengthened after Biogen (BIIB) reported better than expected quarterly EPS and jumped 7.64% on very heavy volume.
Pre-Market Action
Renewed strength in Asia, despite overnight losses, and continuing positive earnings results are lifting U.S. futures this morning. The Dow Jones futures are higher by 15 points. Crude oil ($WTIC) is down to $44.56 testing the July 11th close of 44.55. That was the lowest close since May 10th.
General Electric (GE) reported an impressive earnings beat but is down in pre-market action to 31.78 at last check. Given the current technical state, I'd expect to see GE rally off its opening gap lower.
Current Outlook
Bull markets tend to ignore warning signals, climbing that proverbial "wall of worry".....until it doesn't. Betting against a bull market can be extremely painful, however, so it's best to remain cautiously bullish as warning signs emerge. Poor index and sector rotation, a strong treasury market, lighter than normal volume on the recent S&P 500 breakout, relative weakness in banks ($DJUSBK) and seasonal bearishness are all current warning signs, but they should all be considered secondary to the bullish price action that's taken place since the Brexit-related drop at the end of June. As a result, consider looking at strong earnings results from areas like energy (XLE), materials (XLB) and technology (XLK) for potential long positions. Industrials (XLI) also have strengthened considerably and should be considered as well.
Sector/Industry Watch
The Dow Jones U.S. Tires Index ($DJUSTR) have historically performed very well during July as the seasonal chart below in the Historical Tendencies section shows. This has been important because during the two month stretch from late April through late June, the DJUSTR lost approximately 25% of its value. Technically, the group has grown much stronger as Thursday's close was above its 50 day SMA for the first time since late April. Check it out:
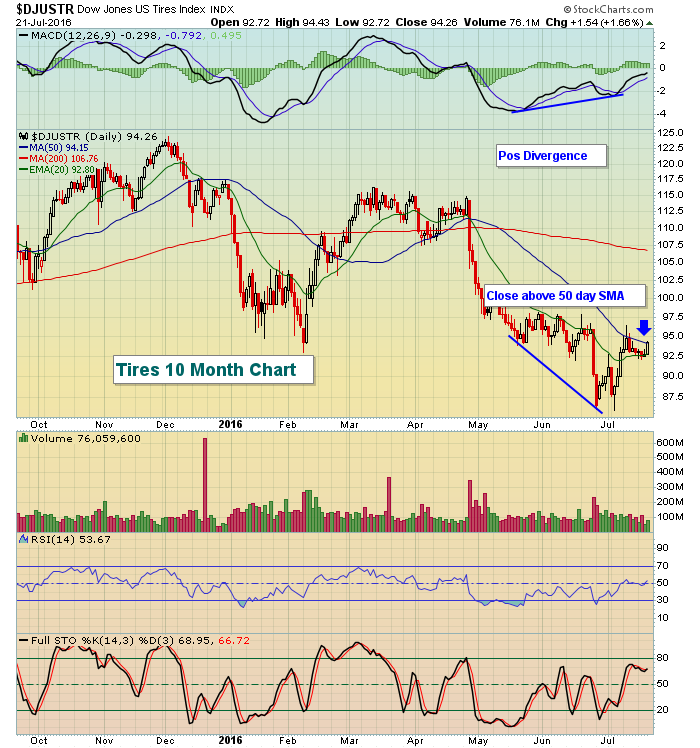 Note also that the rising 20 day EMA has been holding of late on recent tests. That's also a positive technical development and so long as it continues, I'd expect the see the recent strength continue.
Historical Tendencies
We still have another third of July left and so far it's been conforming to historical patterns. August and September could be a challenge, but as long as technical conditions are strong, I'd be okay owning stocks in this space. Here's the seasonal history over the past 16 years:
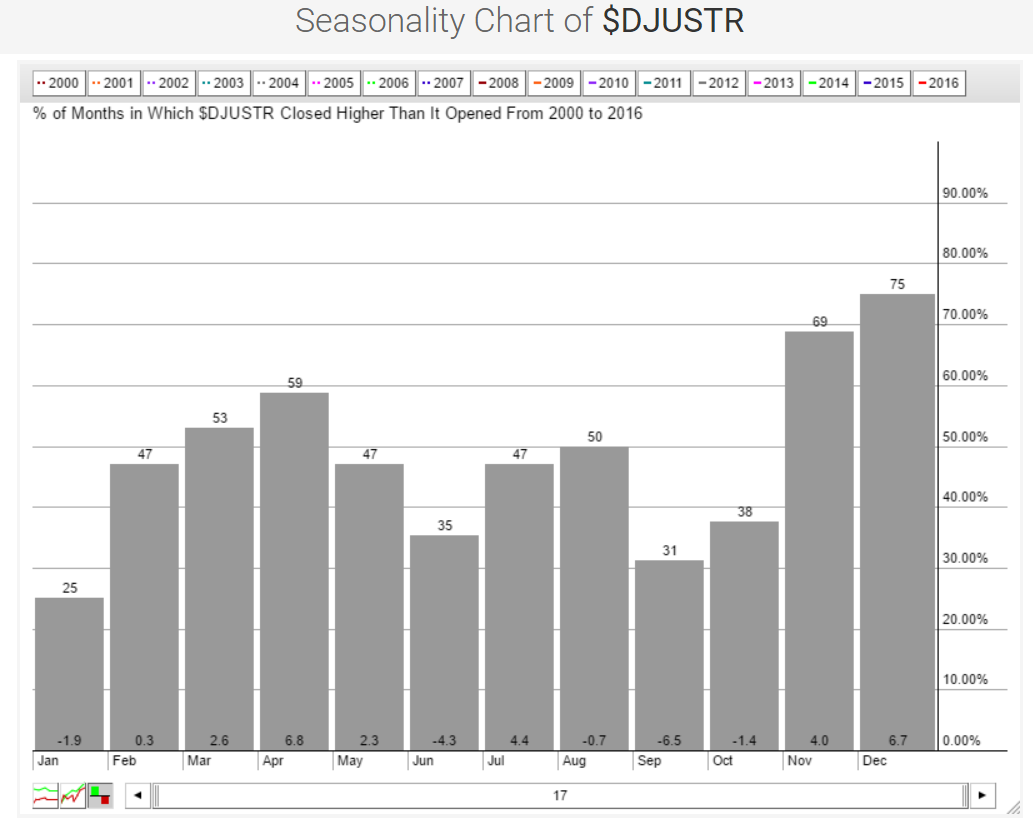 Over the past 17 years, July has produced an average 4.4% monthly return. Given the technical breakout and the strong seasonal pattern, I'd expect more strength to close out the month.
Key Earnings Reports
(actual vs. estimate):
AAL: 1.77 vs 1.60
GE: .51 vs .46
HON: 1.66 vs 1.64
MCO: 1.30 vs 1.24
STI: .89 vs .87
Key Economic Reports
July PMI manufacturing to be released at 9:45am EST: 51.9 (estimate)
Happy trading!
Tom
