Market Recap for Friday, July 22, 2016
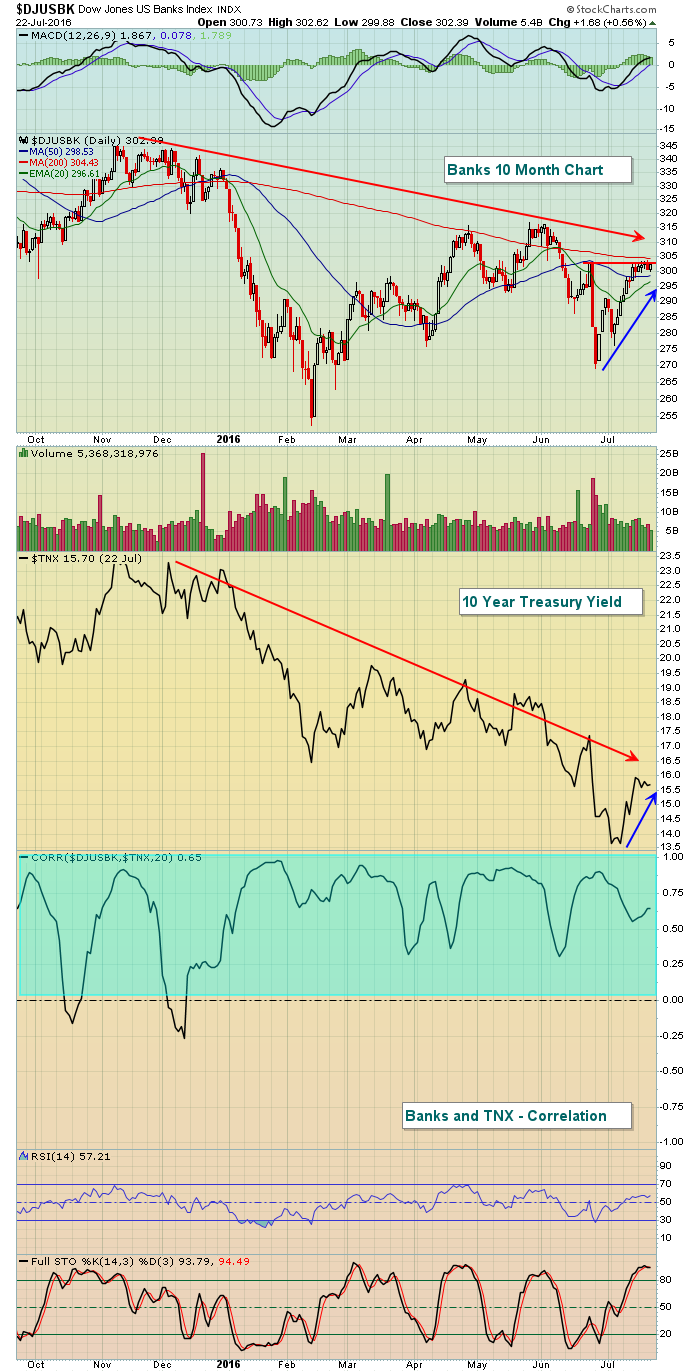
Utilities (XLU, +1.33%) surged on Friday to lead all nine sectors higher. All of our major indices also finished higher with most of the gains generated in the afternoon session as traders went home happy for the weekend. Many of the same warning signs remain, but the bullish price action must be respected. Financials (XLF, +.64%) also had a very nice day with leadership from a variety of industry groups - both offensive and defensive. Banks ($DJUSBK) have rallied off recent lows mostly in lock step with the bounce in the 10 year treasury yield ($TNX). Clearly, banks will be impacted by the reaction to the FOMC announcement later this week. Check out the positive correlation between the two:
 Market participants will be watching the Fed's actions very closely as the DJUSBK has struggled to take out its pre-Brexit level just above 300. A higher yield later this week would likely trigger a continuing rally in the very influential banking space.
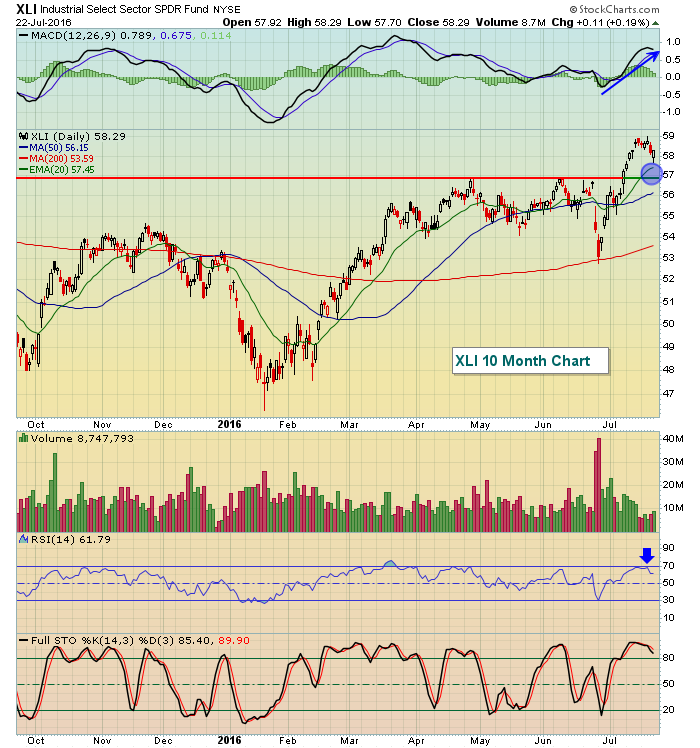
Industrials (XLI, +0.19%) were the weakest sector on Friday, but that chart couldn't be much more bullish with recent selling not even testing its breakout level or price support. Check it out:
 The daily MACD shows strengthening momentum and the blue shaded highlights key short-term support should the market endure some profit taking. That is not out of the realm of possibilities as the overbought RSI at 70 last week would suggest.
Pre-Market Action
Earnings will ramp up significantly this week. While the number of behemoth companies reporting will begin to slow, the next tier of key technology and consumer discretionary stocks will be reporting, culminating with 433 companies set to report on Thursday and over 1100 reporting this week.
The next scheduled FOMC meeting begins tomorrow morning with the latest announcement due on Wednesday at 2pm EST. Obviously, that will be watched to see if Fed officials have changed their tune in terms of the next interest rate increase. The 10 year treasury yield ($TNX) has been on the rise of late, triggering a bit of speculation that the Fed might get a bit more aggressive earlier than most expect. Personally, I'd look for the Fed to deliver exactly what the market expects - no surprises.
Dow Jones futures are flat as crude oil ($WTIC) remains under pressure. Crude oil is down another 1.54% today, but is approaching a key area of technical support from $40-$43 per barrel. I expect that level to hold.
Current Outlook
Not much has changed over the past week to ten days really. On the S&P 500, stochastic is very overbought at 95 because that benchmark index has been closing near the high of its recent 3 week trading range. That's key to the calculation of stochastic. The RSI, however, is more dependent on the size of the daily gains vs. the size of the daily losses. Because we've been trading in a low volatility environment, gains have been generally quite small on a daily basis resulting in a daily RSI of 65 - still below the overbought 70 level. Therefore, based on these two momentum indicators, we've got more upside before both confirm overbought conditions. A heavy dose of quarterly earnings, combined with the next FOMC announcement, could provide more volatility and provide the bears with some ammo, but for now I believe we have to respect the current environment and trend. That suggests the long side of the trade remains the more appropriate side.
Sector/Industry Watch
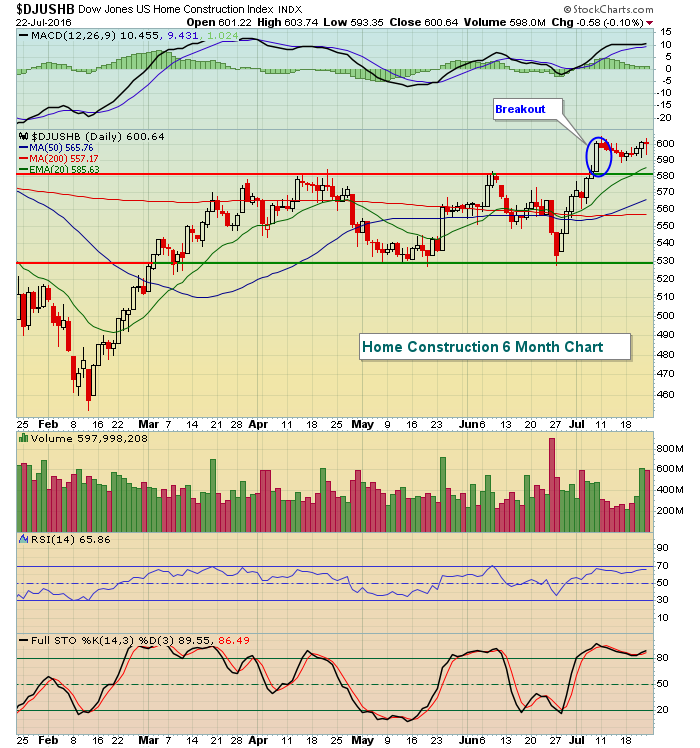
Despite the recent rise in treasury yields, the Dow Jones U.S. Home Construction index ($DJUSHB) has made a notable breakout above a key price resistance level and has held it. Check this out:
 After trading in a 530-580 range for four full months, the DJUSHB broke out and now appears prepared to advance to the 620-630 area. That could set up nice trading opportunities in the space, although the FOMC announcement on Wednesday could provide some short-term volatility and risk. In my setups for this week, I'm including a home construction stock that technically is set to jump. I'll discuss it during my webinar discussed below in the Monday Setups section.
Monday Setups
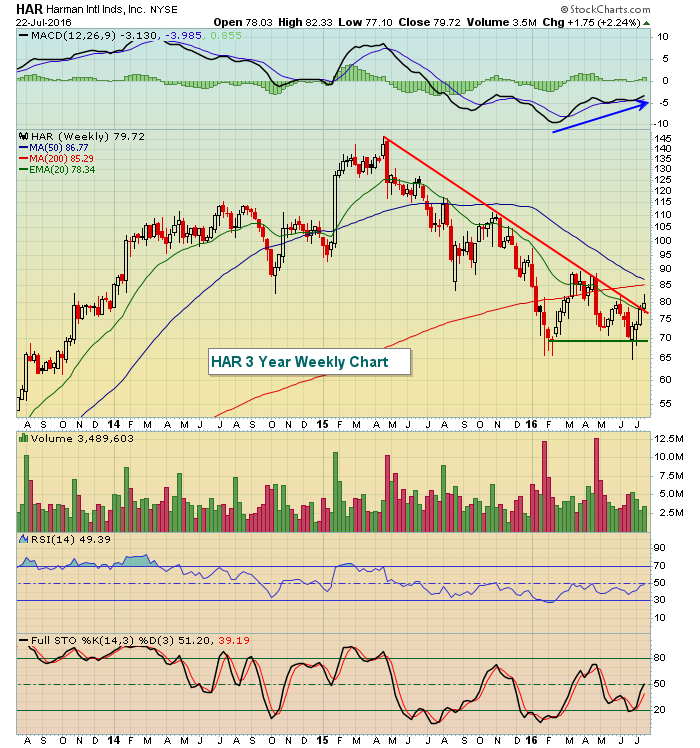
Harmon International (HAR) is a stock to watch as we enter the August through October period. Historically, this has been an awesome period for consumer stocks and HAR recently showed improving momentum (MACD) on its double bottom. Check out the chart:
 In addition to improving momentum, HAR appears to have broken its weekly downtrend line. I would expect it to hold its rising 20 week EMA on future periods of selling. Initial resistance will be in the 89-90 area. I will discuss this setup in more detail during my Trading Places LIVE webinar today at 1pm EST, in addition to a couple more setups for this week.
Historical Tendencies
The bulls averted historical headwinds last week and now look to benefit from seasonal strength. The July 25th through August 2nd period has produced annualized returns of 19.38% (roughly double the 9% average annual returns that the S&P 500 normally enjoys) since 1950.
Key Earnings Reports
(actual vs. estimate):
KMB: 1.53 vs 1.48
S: (.06) vs (.08)
(reports after close, estimate provided):
AVB: 2.09
ESRX: 1.57
GILD: 3.04
TXN: .72
Key Economic Reports
None
Happy trading!
Tom


