Special Notes
Beginning today, I will be providing a "Monday setups" section every Monday, offering up potential trading candidates and technical reasons for possible entry. Please do your own due diligence - both technically and fundamentally - before you decide to trade any of these candidates. They will be provided for educational purposes.
Also, my webinar schedule has changed. Instead of providing three free one hour Trading Places LIVE webinars each week on Monday, Wednesday and Friday from noon to 1pm EST, I'll be providing the following:
The Bowley Briefing on Mondays and Wednesdays from noon to 12:30 EST. This webinar is free to everyone and you can register for today's webinar by CLICKING HERE.
Trading Places LIVE will continue, but will be available to StockCharts members only on Mondays from 1pm-2pm EST. It will be similar to the current format, but will include the discussion of several annotated trading setups each week. You can register for today's webinar by CLICKING HERE.
Market Recap for Friday, July 8, 2016
Well, the bulls have done it. The S&P 500 has once reached the brink of a breakout to an all-time high close. Its highest close was on May 21, 2015 at 2131 and on Friday the S&P 500 touched that level with an intraday high of 2131.71 before closing at 2129.90. Historically, this is a good week for U.S. equities so there's an opportunity at hand for those in the bullish camp. Obviously, the first thing required is the all-time closing breakout. The second requirement to sustain the advance would be an increase in volume to confirm the breakout. Finally, it would be helpful to see money flow into aggressive areas of the market to lead the breakout. That's a tall order and so far it's been one that's fallen short for months.
Here's a snapshot of the last two years on the S&P 500 so that you can see the technical significance of a price breakout:
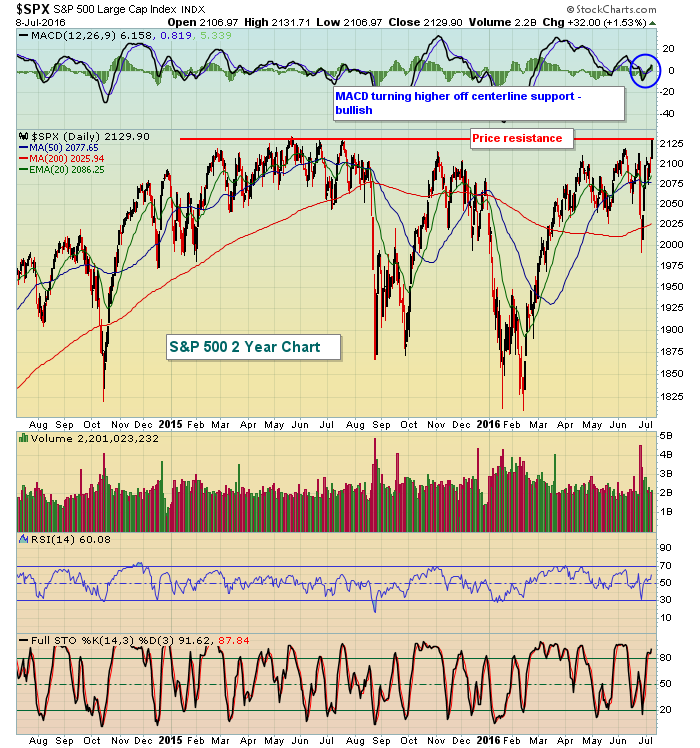 Materials (XLB, +2.49%), industrials (XLI, +2.00%) and financials (XLF, 1.91%) led the advance on Friday. It's always nice to see a couple of the aggressive sectors (XLI and XLF) leading the rise and financials, in particular, have been lagging the rest of the market. In fact, financials are featured below in the Sector/Industry Watch section as their relative weakness has been quite apparent.
Pre-Market Action
Crude oil ($WTIC) is up fractionally this morning while treasuries have sold off early with the corresponding 10 year treasury yield ($TNX) jumping to 1.41%. The yield reaction to the strong jobs report last week has still been very weak in the treasury market.
U.S. futures are getting a lift from overseas markets as the Tokyo Nikkei ($NIKK) soared more than 600 points overnight. That index remains technically challenged, but the volatility has been strong. In addition, European markets are strong this morning and that's enabled Dow Jones futures to tack on another 80 points to challenge its all-time high set in May 2015. The S&P 500 futures are pointing to an open that's in record high closing territory. A close above 2131 today with leadership in aggressive sectors would be bullish.
Current Outlook
We'll get our first glimpse of second quarter earnings when Alcoa (AA) kicks off earnings season this afternoon after the closing bell. AA has major price support near 9.00 so one thing to look for tonight is whether AA can hold onto this support level after releasing its quarterly results. Check out the support level:
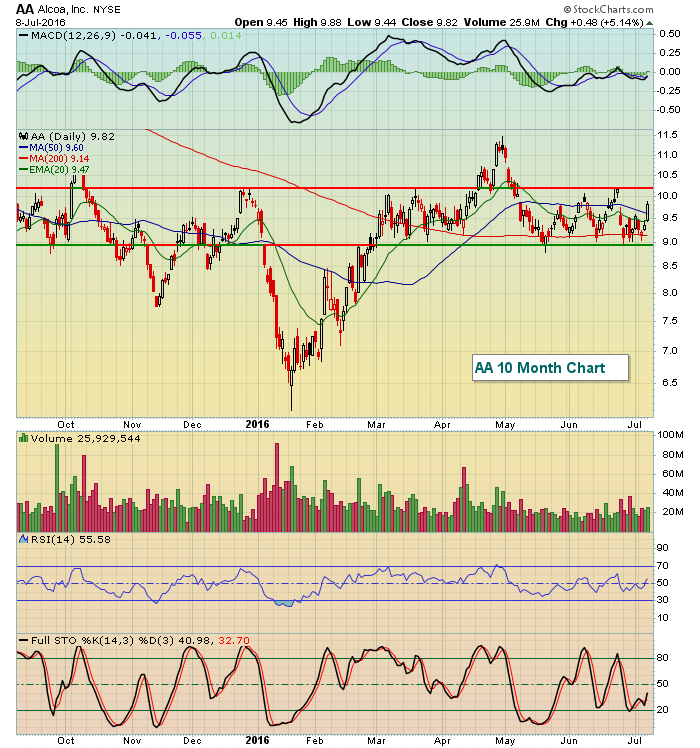 While AA isn't a behemoth company like many we'll see reporting later this week and into the next couple weeks, it's still widely considered the first major report of earnings season. In addition to price support close to 9.00, a significant price resistance level near 10.25 should also be watched if AA gaps higher after earnings. An open tomorrow morning above that level would likely lead to higher prices.
Sector/Industry Watch
I look to relative strength in financials, especially banks, to help sustain a stock market rally. There's been little relative strength in either as you can see from the chart below:
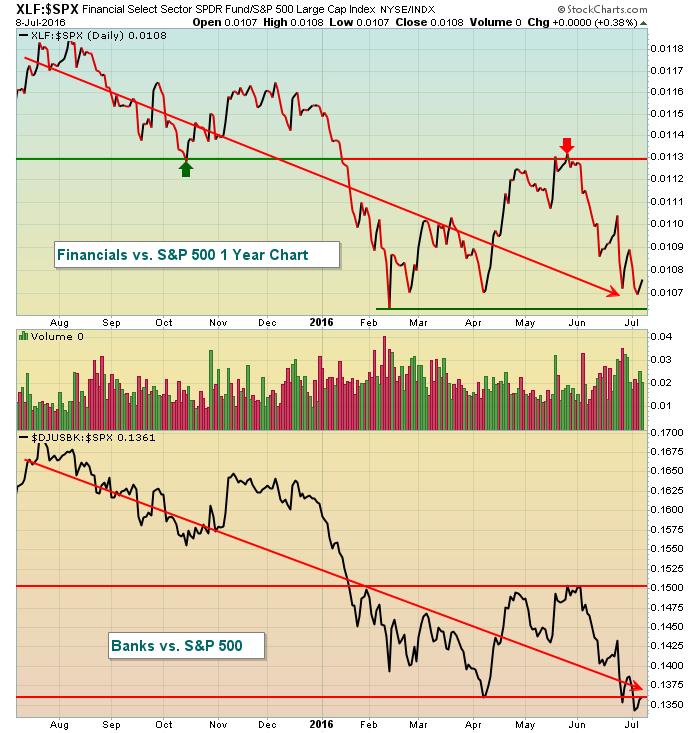 The relative downtrend in both financials and banks can be seen easily from the chart above. The banks have performed worse than the overall financial sector mostly because REITs have performed exceptionally well on a relative basis, holding up the entire sector. I'd like to see banks perform much better on a relative basis to sustain the next leg of this seven year bull market. For now, that's only a pipe dream.
Monday Setups
Sierra Wireless (SWIR) recently broke its downtrend on its weekly chart and is performing much better technically, holding its now-rising 20 week EMA. There's a decent chance we've seen a bottom here, take a look at the current chart:
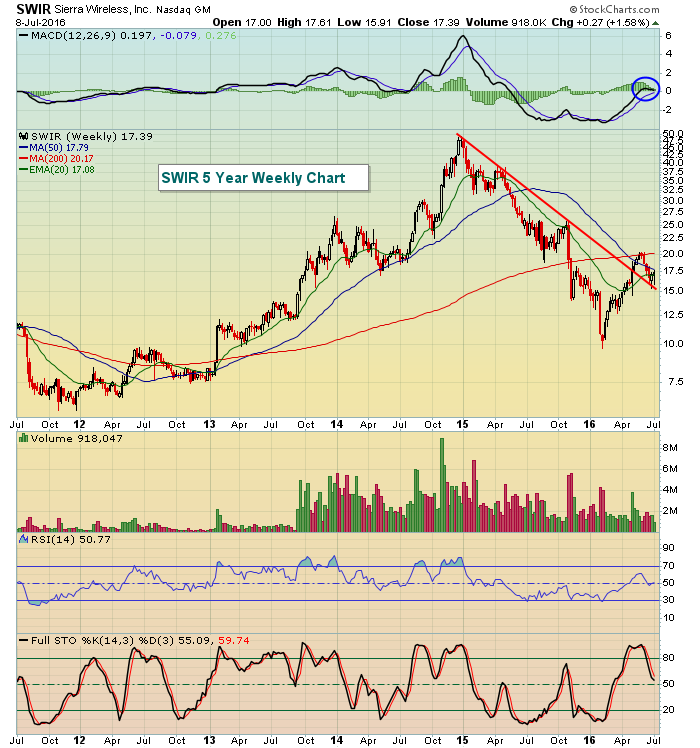 There are other interesting technical aspects of this chart that I'll discuss in my Trading Places LIVE webinar scheduled for today at 1pm EST. I'll also discuss 2-3 other trading setups, but you need to be a member of StockCharts to access this webinar.
Historical Tendencies
This is the final week of seasonal bullishness before the worst two month consecutive period begins. July 18th through September 27th produces the worst results on the S&P 500 since 1950. This week, however, has typically performed quite well as the annualized returns by day illustrate:
July 11th (today): +23.67%
July 12th (tomorrow): +23.87%
July 13th (Wednesday): -3.40%
July 14th (Thursday): +57.41%
July 15th (Friday): +5.54%
Key Earnings Reports
(actual vs. estimate):
OZRK: .60 vs .58
(reports after close, estimate provided):
AA: .09
Key Economic Reports
None
Happy trading!
Tom


