Market Recap for Monday, August 1, 2016
Monday marked another day of mixed action. The NASDAQ continues to power forward, leading the action. Since July 14th, the NASDAQ has advanced more than 150 points or roughly 3%. During that same time frame, the S&P 500 has barely budged, rising just 7 points or 0.33%. That relative strength by the NASDAQ is very important to sustain the current rally, but we're missing other "under the surface" signals of sustainability. Therefore, we should remain "cautiously" bullish for now. I've analyzed the NASDAQ's current technical state in the Current Outlook section below.
Speaking of aggressive areas, the Dow Jones U.S. Biotechnology Index ($DJUSBT) surged on Monday to clear multi-month resistance. The DJUSBT gained 1.88% and the breakout is clear as highlighted below:
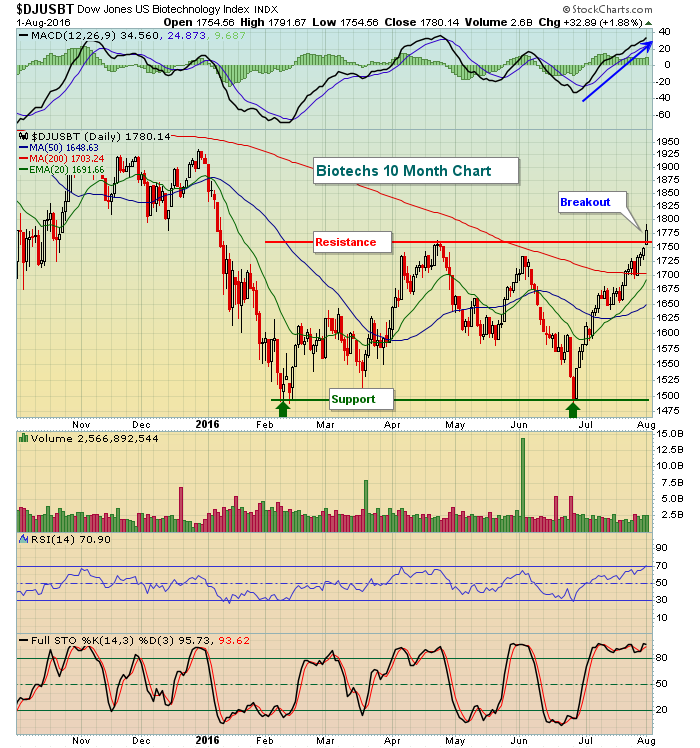 In addition to the obvious recent strength reflected above, it should be noted that the DJUSBT's weekly chart has strengthened considerably as well. Though it's not shown here, the DJUSBT now resides above its 50 week SMA for the first time in nearly a year.
Energy (XLE, -3.29%) lagged the rest of the market very badly with the XLE finishing just above 65. 64 is a very big level of price support and should be monitored closely. Crude oil prices ($WTIC) have tumbling and yesterday touched $40 per barrel for the first time since April. A close below $40 begins to paint a more bearish picture longer-term.
Pre-Market Action
The Tokyo Nikkei ($NIKK) lost 244 points overnight and selling has accelerated a bit this morning in Europe. Dow Jones futures are down slightly - approximately 20 points at last check. Treasuries are selling this morning with the 10 year treasury yield ($TNX) rising to 1.55% in early action.
Current Outlook
The NASDAQ has been bullet-proof since Brexit. We've been moving straight up with barely a pause. The NASDAQ looked very similar in the first half of July 2015, setting its all-time high, just before the usual mid-July to late September weakness kicked in. Thus far, however, mid-July has not presented any problems. Will August be any different? Take a look at the last 18 months on the NASDAQ:
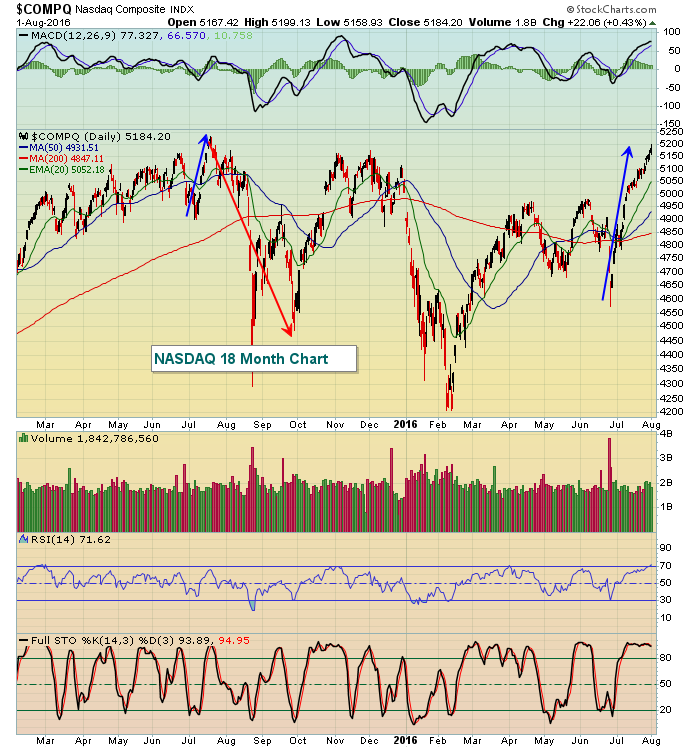 Unlike the S&P 500, the NASDAQ is overbought after its recent strength. The two key areas of support on the NASDAQ, should selling begin to accelerate, would be the rising 20 day EMA, currently at 5052, and then the double top breakout from 4980 should offer up price support.
Sector/Industry Watch
The Dow Jones U.S. Steel Index has been performing quite well in 2016 and is currently consolidating after recently breaking out, then backtesting the breakout level. Check this out:
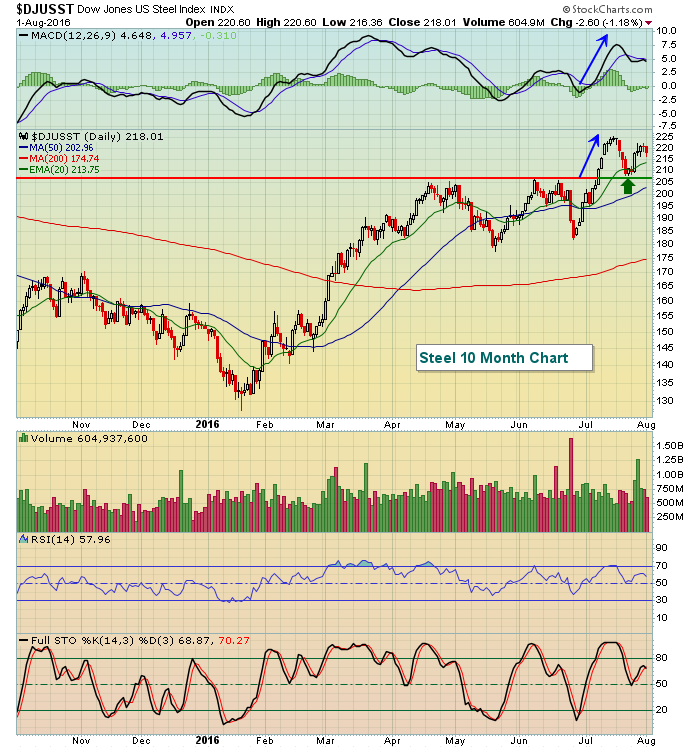 With the latest price breakout, the daily MACD was strong and strengthening (blue lines with arrows). Compare that to the breakout in April when the MACD never moved to higher highs. That "negative divergence" led to much weakness over the month. Currently, the technical state appears very bullish. I'd be surprised if the DJUSST lost price support near 207.
Historical Tendencies
Mondays and Tuesdays have historically been the two weakest consecutive days of the calendar week. Monday has been BY FAR the worst performing day of the week with an annualized return of approximately -15% since 1950 on the S&P 500.
Key Earnings Reports
(actual vs. estimate):
ADM: .41 vs .44
AET: 2.21 vs 2.11
CAH: 1.14 vs 1.13
CMI: 2.40 vs 2.15
CVS: 1.32 vs 1.30
PBI: .39 vs .42
PFE: .64 vs .62
PG: .79 vs .74
STX: .69 vs .60
TAP: 1.11 vs 1.13
(reports after close, estimate provided):
AIG: .91
EA: (.14)
VRSK: .76
Key Economic Reports
June personal income released at 8:30am EST: +0.2% (actual) vs. +0.3% (estimate)
June personal spending released at 8:30am EST: +0.4% (actual) vs. +0.3% (estimate)
Happy trading!
Tom


