Market Recap for Tuesday, August 2, 2016
There was no bifurcated action on Tuesday. There were no major indices threatening breakouts and eight of the nine sectors fell. Finally, the NASDAQ and Russell 2000 saw some much-needed profit taking after a long steady advance off their late-June lows. The S&P 500, with strong momentum on its side, tested its rising 20 day EMA for the first time in a month and held. Check out yesterday's action:
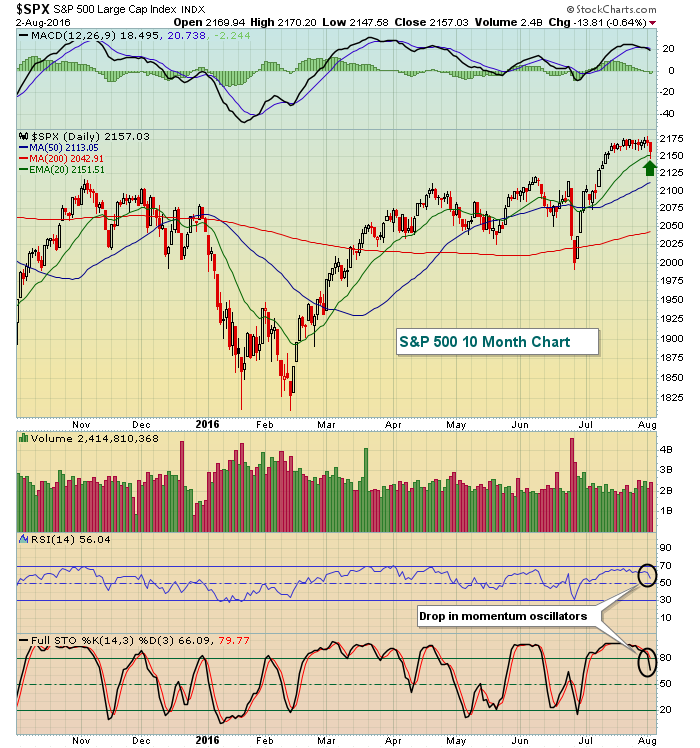 The green arrow marks Tuesday's successful test of its rising 20 day EMA. At the bottom of the chart, you can see that the S&P 500 is finally seeing some relief as both its RSI and stochastic readings have dropped to their lowest levels in a month.
After a brutal day on Monday and a very weak 3-4 week stretch, energy (XLE, +0.91%) saw some relief in the opposite direction and was the only gaining sector. It was an important reversal too as the XLE approached very key price support. Check it out:
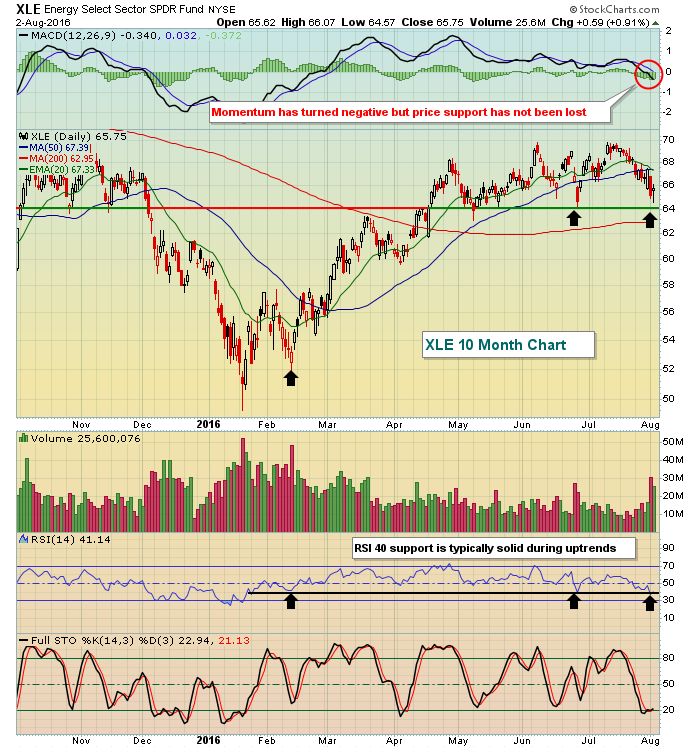 The daily MACD on the XLE has crossed beneath centerline support, but this occurs occasionally when price action hovers near price support. I'd be more concerned technically if price support at 64 is lost. The RSI has moved down to the 40 level and that's generally a great support level on the RSI when a stock, ETF or index is in an uptrend.
Pre-Market Action
Futures are down slightly as the selling encountered on Tuesday appears likely to continue - at least into the open. Crude oil ($WTIC) below $40 per barrel is likely weighing on global markets, as is overhead price resistance. The German DAX, for instance, reversed yesterday after touching a very critical 2016 price resistance level. Take a look:
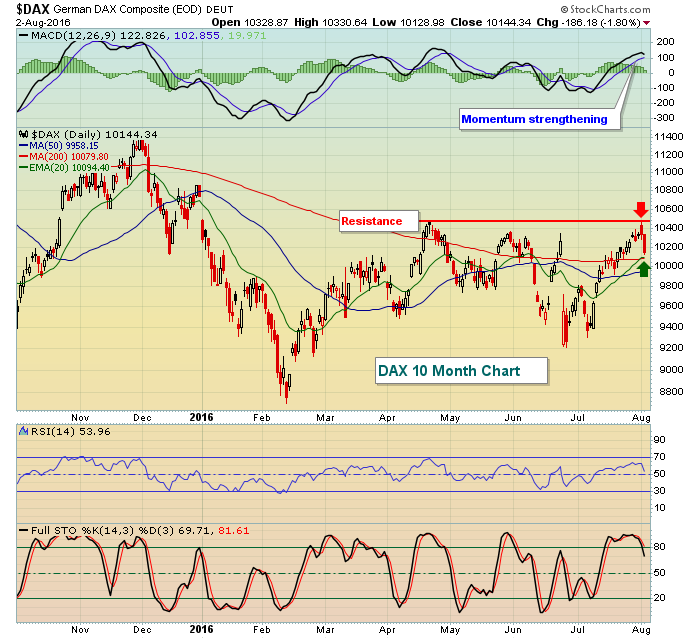 The red arrow marks price resistance while the green arrow marks rising 20 day EMA support, typically solid support with a strengthening MACD. This morning, the DAX is down 18 points to 10126, slightly above that 20 day EMA. It'll be interesting to see which level breaks first as there's been a very strong positive correlation between the German DAX and S&P 500 for many years. A technical failure in Germany would add to the list of worries here in the U.S.
The ADP employment report beat consensus estimates (see Key Economic Reports section below) but that has had little impact thus far on either equity futures or the treasury market. The 10 year treasury yield ($TNX) is at 1.53%, very slightly below Tuesday's close.
Current Outlook
A rising Volatility Index ($VIX) is normally a necessary ingredient for a falling equity market. From the chart below you can see that the VIX closed yesterday at its highest level in three weeks. In addition, I've circled the past several trading sessions as there have been multiple intraday spikes in the VIX only to see it retreat by day's end. On Monday, though, the rise in the VIX held into the close despite the S&P 500 once again closing near all-time high levels. That was a bit of a warning sign that perhaps Tuesday's selling would stick - and it did. Check out the increasing fear level:
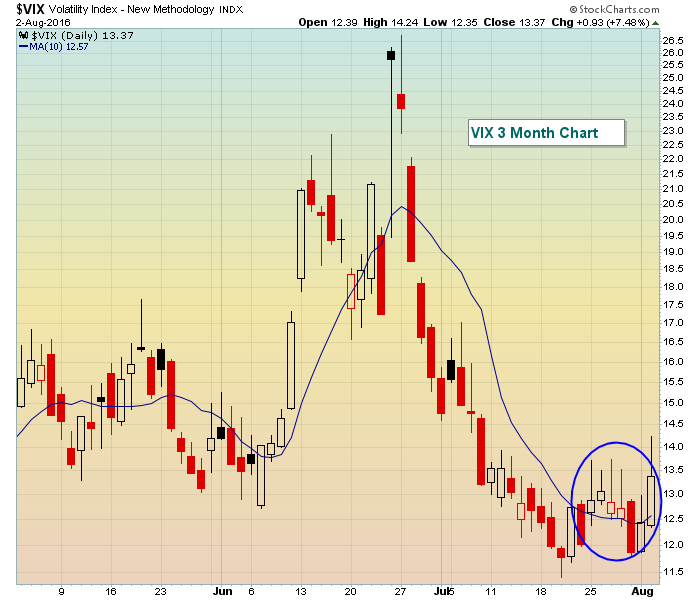 For the fifth time in the past six trading sessions, the VIX closed at or above its 10 day SMA. While this guarantees us nothing, it does show that the recent VIX downtrend could have ended with a double bottom that printed last Friday. I'd keep an eye on the intraday low on the VIX from Tuesday. As long as that low holds, I'd be careful on the long side in the near-term. The longer-term view remains bullish so long as the VIX holds below 16.50-17.00.
Sector/Industry Watch
Many sectors and industries could use a little more profit taking for sure. Some look worse technically than others, however, so let's focus on one industry group - Dow Jones U.S. Specialty Retailers Index ($DJUSRS) - that could be primed for further short-term weakness:
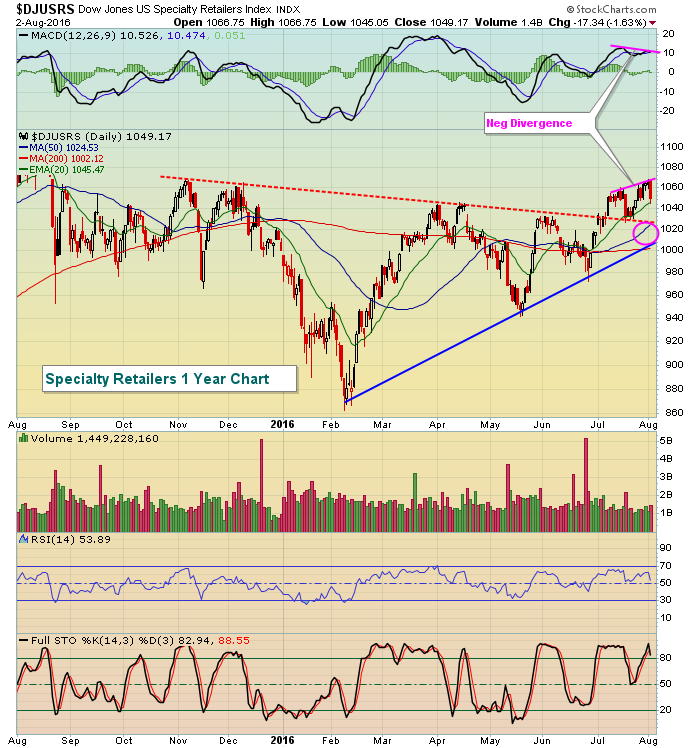 Specialty retailers suffered one of its worst days in the past few months yesterday and based on that negative divergence, a 50 day SMA test is certainly not out of the question. Also, there's an uptrend line in play that could be tested with additional selling. Therefore, I'd consider the pink circle above to be a target area for the DJUSRS.
Historical Tendencies
The 1st through 6th calendar days are typically among the strongest for all calendar months. But on the NASDAQ, since 1971, August 1st through 6th has produced negative annualized returns of -26.60%.
Key Earnings Reports
(actual vs. estimate):
CLX: 1.26 vs 1.28
HUM: 2.30 vs 2.26
OXY: (.18) vs (.20)
(reports after close, estimate provided):
CF: .68
FSLR: .57
HLF: 1.17
JACK: .87
LNC: 1.56
MET: 1.36
PRU: 2.49
SUN: .44
TRIP: .31
TSLA: (1.15)
Key Economic Reports
July ADP employment report released at 8:15am EST: 179,000 (actual) vs. 165,000 (estimate)
July ISM non-manufacturing index to be released at 10:00am EST: 56.0 (estimate)
Happy trading!
Tom


