Market Recap for Friday, August 8, 2016
Friday was a very solid day for the bulls and not just because the S&P 500 closed at all-time highs again. The part I liked the most was the leadership of the financial sector (XLF, +1.91%). The strength was apparent as the second best sector was consumer discretionary (XLY, +1.05%), whose strength was barely half the XLF. Life insurance ($DJUSIL) and banks ($DJUSBK) led financials after above-consensus July jobs sent the 10 year treasury yield ($TNX) higher. That sparked many interest-sensitive areas, including both the DJUSIL and DJUSBK. Check out the overall breakout in the Dow Jones U.S. Financials Index ($DJUSFN) and the volume increase:
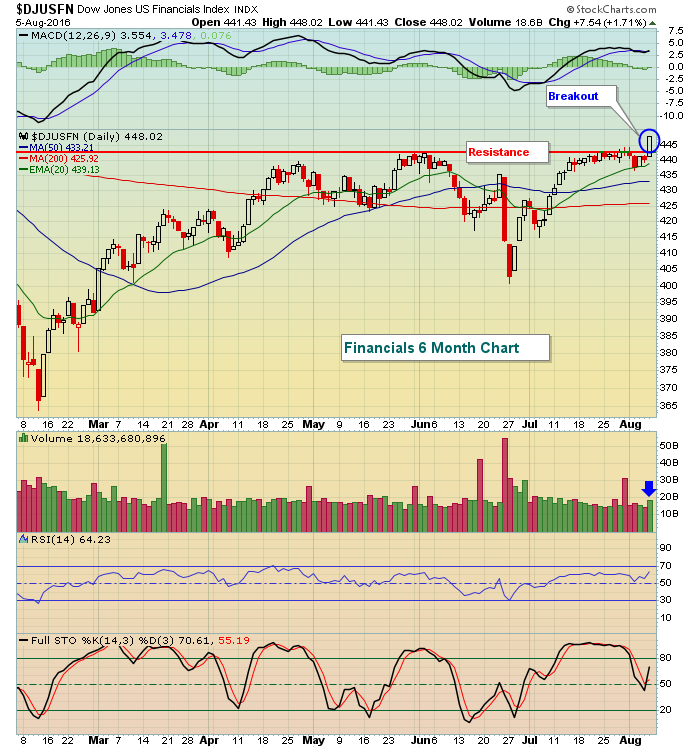 The volume increase may not look like a huge surge, but keep in mind it's the start of August where volumes tend to be very light. It is important that an increase in volume accompanied Friday's rally and breakout.
The rally did not cover every sector, however, with utilities (XLU, -1.44%) suffering mightily from the higher treasury yield. Gains in the other defensive sectors - consumer staples (XLP, +0.17%) and healthcare (XLV, +0.24%) - were tempered as traders definitely migrated much more toward risk.
Pre-Market Action
There is little economic news today and while there are more than 200 companies reporting their latest quarterly results today, the number of "market moving" stocks reporting earnings are slim. So we might look around the globe for direction today. 10457 is a big closing level on the German DAX ($DAX) and the DAX is trading at 10427 at last check. Given the positive correlation between the DAX and the S&P 500, a breakout in the DAX should be viewed bullishly for the S&P 500. We're close so keep an eye on it.
Also, watch the 10 year treasury yield ($TNX), which is up this morning to 1.60%. Since the gap down post-Brexit, the TNX has not closed above 1.60%. A close above it would signal a short-term rotation out of treasuries and that also could fuel the current S&P 500 rally.
Weak Chinese data overnight did little to slow the rally in Asian markets and crude oil ($WTIC) continues its recent advance off lows just beneath $40 per barrel.
Current Outlook
One ratio that I follow very closely every day is the XLY:XLP (consumer discretionary vs. consumer staples). It's a very quick way to see which direction money is rotating within the consumer space. A rising ratio means money is turning more aggressive while a declining ratio signals the opposite. While the ratio is still well off its 2016 high, there is no doubt that money has been rotating in much more bullish fashion since Brexit and the recent S&P 500 low. Check out this bullish rotation since late June:
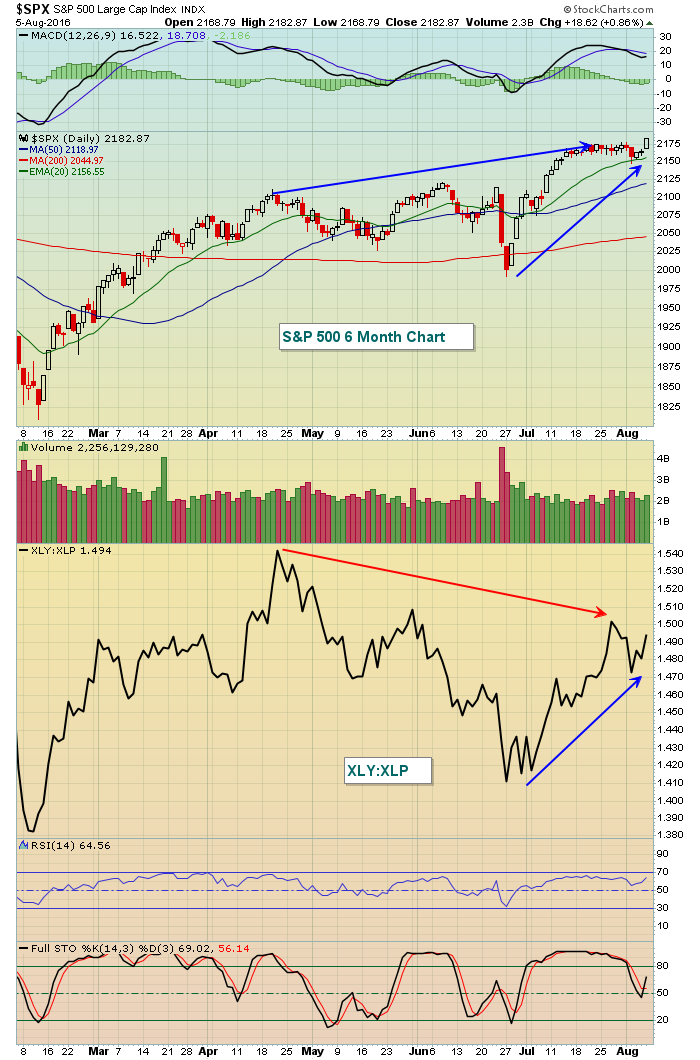 The bigger picture still remains cloudy for sure as the XLY:XLP ratio is down since April. This tells us that as the S&P 500 has rallied, money has rotated away from risk, a bearish signal. However, this most recent rally has seen a very different environment as Brexit seemed to produce an entirely different reaction than what most traders expected. Money has very heavily rotated into risk like the XLY and that paints a short-term bullish picture until we see other bearish developments occur - or until this ratio turns lower again.
Sector/Industry Watch
The Dow Jones U.S. Transportation Index ($DJUSTS) surged on Friday, gaining 3.07% and, in the process, further confirming the break out of a bullish inverse head & shoulders pattern that occurred on Thursday. Check it out:
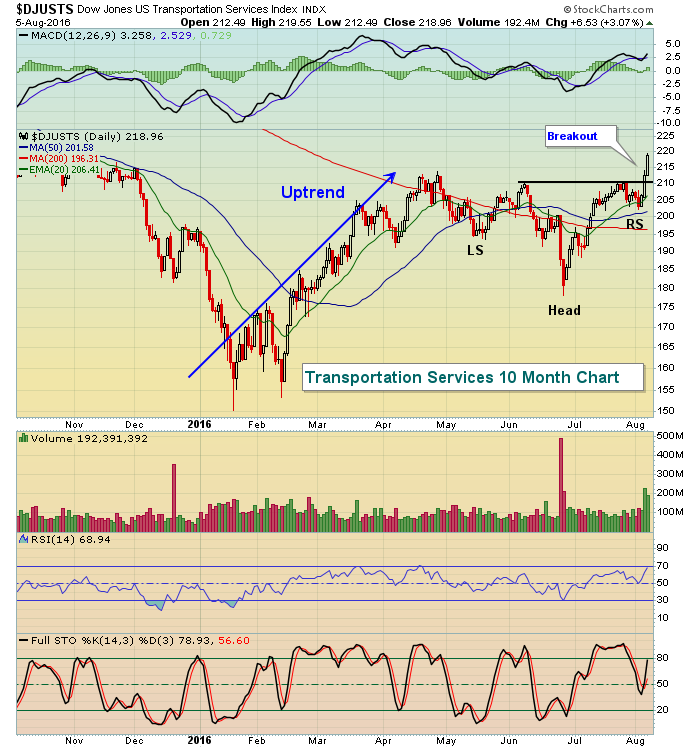 Momentum is strong, as was the volume at the end of last week to confirm the breakout. While a pullback to 210 price support or the rising 20 day EMA, currently at 206.41, can be expected, the overall trend here is likely to be higher. Losing the support levels would require re-evaluation, but trading stocks within this space would make sense given the bullish pattern and confirmed breakout.
Monday Setups
I will be releasing my setups for this week later during the Trading Places LIVE webinar that begins at 1pm EST today. You can register for this webinar by CLICKING HERE. For today, I want to demonstrate why patience can many times be rewarded as a trader. Three weeks ago, I listed SLCA as a setup but suggested waiting for entry to allow a negative divergence to play out. Here is a before and after look at SLCA:
Setup as provided on July 18th:
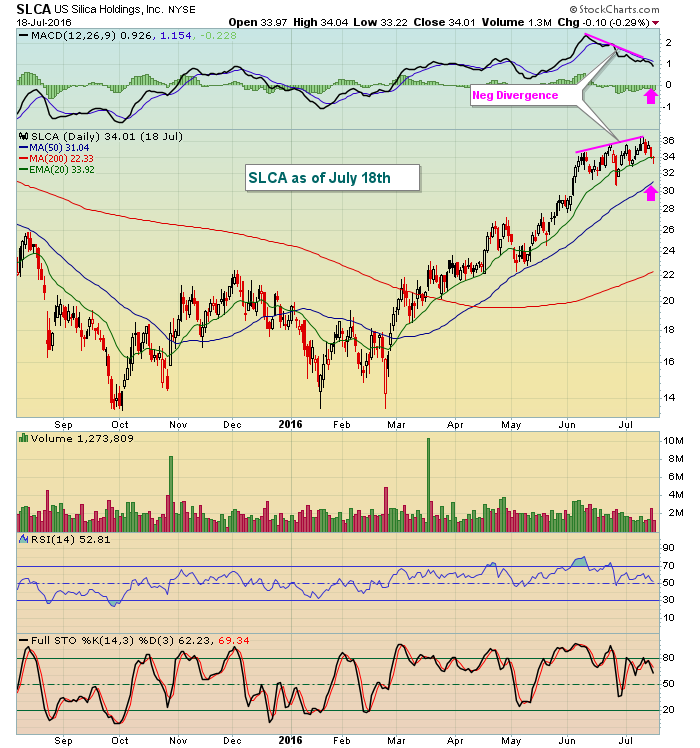 When a negative divergence like this one appears, it's a sign of slowing momentum and the rising 20 day EMA, which previously holds as support, no longer can be counted on in the near-term. Instead, I look for a 50 day SMA test and/or MACD centerline test as a much better reward to risk entry point.
Now check out the rest of the story and how this unfolded:
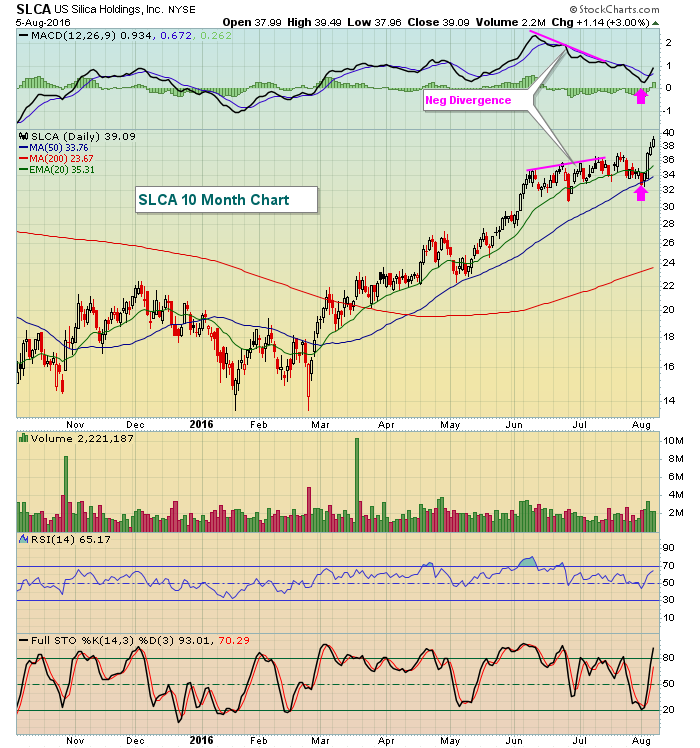 First, let me say that every trade doesn't work out as well as this one did. However, having patience with a stock that's showing signs of slowing momentum and waiting for lower entry is a solid practice that will reduce your risk. Join me in my webinar later and I'll discuss this week's setups!
Historical Tendencies
August is historically a go nowhere month despite Friday's big rally and latest breakout. Of the 31 days in August, 16 have produced negative annualized returns on the S&P 500 since 1950. So while the current rally may continue to show its legs and run, it won't be because of historical tailwinds.
Key Earnings Reports
(actual vs. estimate):
AGN: 3.35 vs 3.29
BID: 1.51 vs 1.05
TSN: 1.21 vs 1.07
(reports after close, estimate provided):
MCHP: .68
NWS: .12
Key Economic Reports
None
Happy trading!
Tom


