Market Recap for Wednesday, August 3, 2016
Strength returned in most areas of U.S. equities on Wednesday, but the gains were more pronounced in the Russell 2000, which rose 0.86%. Among the six sectors in positive territory, none was stronger than energy (XLE, +1.93%) where rebounding crude oil ($WTIC) prices emboldened energy traders. I would look for further strength in energy as it appears a reverse right shoulder has formed in the WTIC. If that's the case, the XLE likely has seen a bottom. I'm featuring the WTIC's bottoming formation in the Sector/Industry Watch section below.
For now, check out the solid technical bounce in the Russell 2000 as it initially tested its rising 20 day EMA:
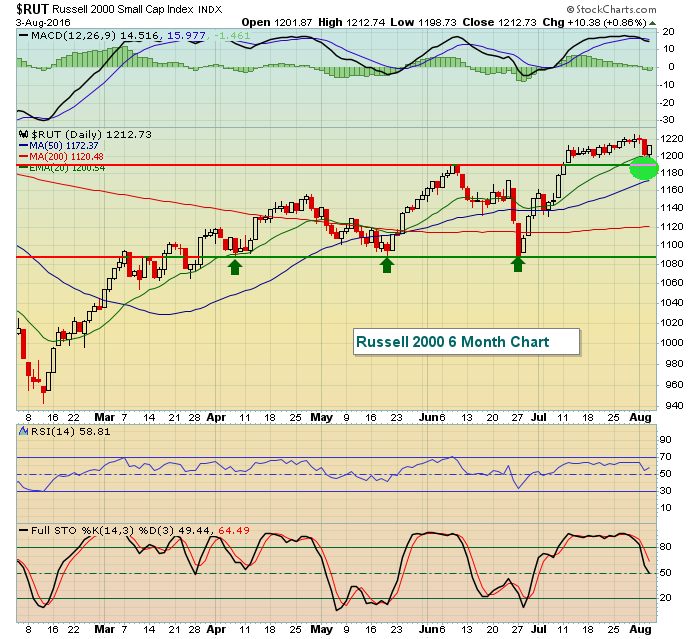 Wednesday's low was just beneath 20 day EMA support before the bounce, but the light green shaded area highlights the area of support we need to watch. Weakness down to 1170 could be tolerated, especially with the rising 20 week EMA (on weekly chart not shown above) now at 1157 and continuing to rise.
The three defensive sectors - utilities (XLU, -0.60%), consumer staples (XLP, -0.55%) and healthcare (XLV, -0.28%) - did not participate in yesterday's rally. If certain sectors don't participate, these are the three I'd choose. Continuing relative strength from aggressive sectors, particularly on another S&P 500 breakout, would help sustain the rally.
Pre-Market Action
Bank of England cut its rate overnight 0.25% for the first time in seven years after Brexit. That has resulted in relative strength on the London Financial Times index ($FTSE) this morning with most other key European markets up fractionally. The BOE cut its growth forecast for 2017 dramatically - from 2.3% to just 0.8% and emphasized it's prepared "to act in exceptional circumstances". Sound familiar? One of the reasons it's so difficult to short stocks is the fact that central bankers stand united around the globe, ready "to act in exceptional circumstances", whatever that means. Essentially, it means we'll do what's necessary to prop up equity prices.
Dow Jones futures are up slightly as crude oil hovers near its break even line this morning. The 10 year treasury yield ($TNX) has fallen more than 3 basis points to 1.51% in pre-market action as both equity and bond markets brace for tomorrow mornings nonfarm payrolls report. Latest consensus estimates are calling for 185,000 jobs. While the Volatility Index ($VIX) was lower yesterday, it has been on the rise of late, suggesting to me the U.S. market is not as well prepared to handle bad news if the jobs comes up short tomorrow. Be prepared to buckle your seat belt!
Current Outlook
The Dow Jones U.S. Financial Index ($DJUSFN) is not the most important industry index to watch, but it definitely ranks high. In particular, it's important that banks ($DJUSBK) participate in rallies. Keep in mind that the stock market always looks ahead so a strengthening banking group is a signal that our economy will likely be strengthening. A weakening economy generally leads to lower interest rates (to stimulate the economy) and those lower rates typically reduce the interest margin that banks enjoy. Also, a weakening economy can begin to result in expanding loan loss reserves. Both of these conditions lower bank profits and eventually lower bank prices. Therefore, solid technical performance by banks relative to the S&P 500 usually sustains bull market rallies. Banks do not need to be among the relative leaders, they simply need to tag along for the ride. More aggressive areas of the market should see profits (and stock prices) escalate more rapidly. Check out this relative chart of banks:
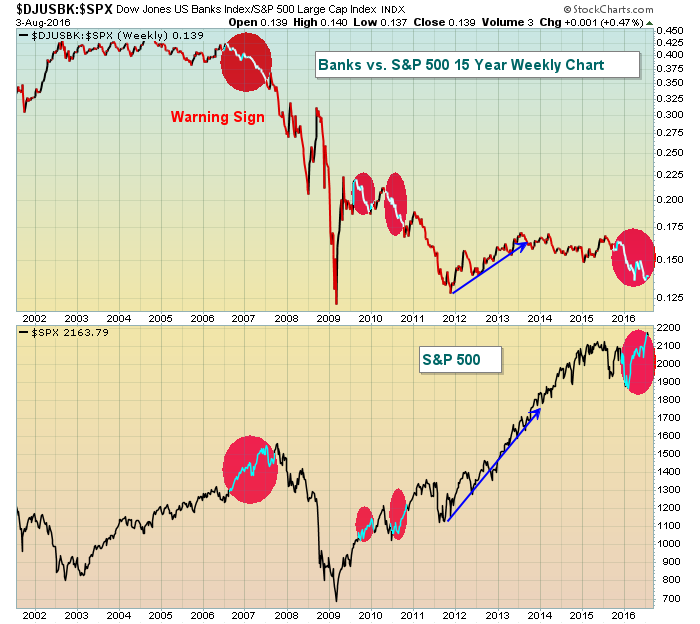 When the S&P 500 is rising, I like to see the DJUSBK:SPX ratio either moving sideways (banks perform equal to S&P 500) or rising (banks outperforming S&P 500). Usually, these two types of relative performance result in S&P 500 strength. But when these two lines diverge (red shaded areas above), it has often led to a stock market decline. As you can see from the above, we are currently in one of those periods where banks are not performing well on a relative basis. Therefore, we must keep our guard up. Hence, my "cautiously" bullish stance on U.S. equities.
Sector/Industry Watch
I've written much about crude oil prices ($WTIC), but I believe it's worth reposting. Technical patterns don't mean a whole lot until they're confirmed, but a beautiful symmetrical reverse head & shoulders pattern has been established with crude oil. As a result, I believe it's worth the risk to assume a short- to intermediate-term bottom is in - possibly even a long-term bottom. Just be prepared to exit this idea if the reverse right shoulder below is lost. Check out the pattern:
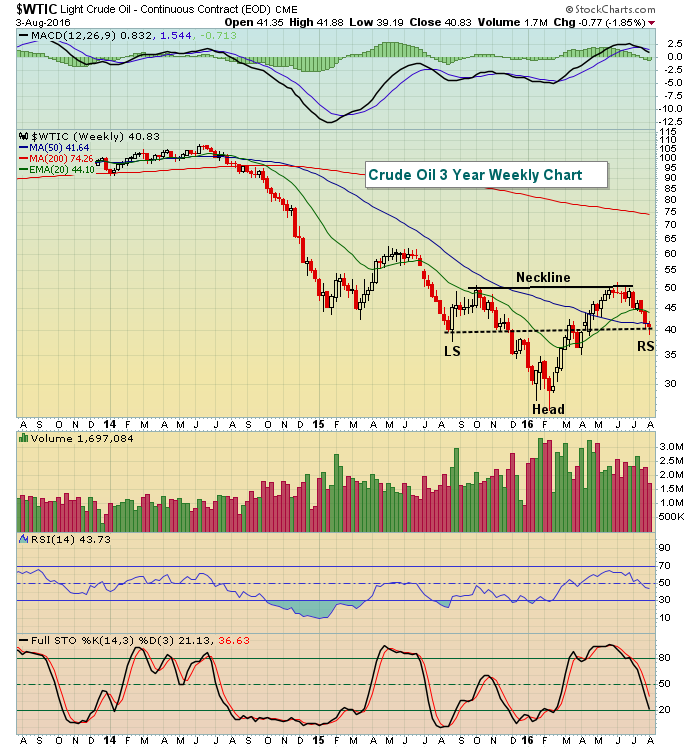 Energy stocks had been struggling of late, mostly because of deteriorating crude oil prices. If the above bottoming pattern is ultimately confirmed, then the XLE represents a solid reward to risk long trade over the next few months. One possible downside, which I wrote about recently, is the fact that seasonality is NOT on the side of oil bulls. Oil prices historically have risen in the first six months of the year with August being the only exception to this historical rule the past twenty years.
Historical Tendencies
On the NASDAQ, August ranks as the 11th best performing calendar month since 1971. Only September boasts a more bearish track record over this period. In addition, since 1990, August is the worst performing calendar month. So a further advance will have to successfully negotiate the seasonal head winds that the NASDAQ has fought for more than four decades.
Key Earnings Reports
(actual vs. estimate):
APA: (.26) vs (.21)
HAR: 1.57 vs 1.52
K: .91 vs .91
MNST: 1.04 (estimate - have not seen earnings yet)
PCLN: 11.54 (estimate - have not seen earnings yet)
(reports after close, estimate provided):
ATVI: .37
FEYE: (.80)
KHC: .71
LNKD: (.06)
TASR: .03
Key Economic Reports
Initial jobless claims released at 8:30am EST: 269,000 (actual) vs. 265,000 (estimate)
June factory orders to be released at 10:00am EST: -1.8% (estimate)
Happy trading!
Tom


