Market Recap for Thursday, November 17, 2016
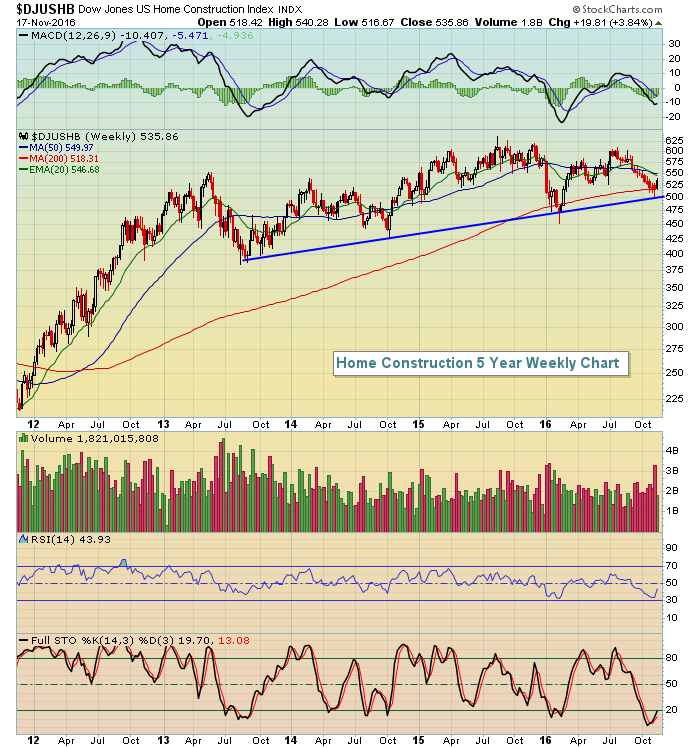
U.S. stocks posted gains once again on Thursday, this time with the benchmark S&P 500 closing within a whisker of an all-time high. Strength came from all the right areas too with financials (XLF, +1.37%), consumer discretionary (XLY, +1.21%), and technology (XLK, +0.61%) leading the advance. Home construction ($DJUSHB) was higher by 3% at the opening bell to get the party started and most other discretionary groups followed. Housing starts and building permits both were reported much higher than expected and the DJUSHB had been down close to 20% from late July to early November. The group needed a boost and got it in the form of very strong fundamental data. The recent reversal was timely as trendline support and the 200 week SMA were both tested at the start of November. Check it out:
 A rally back to the earlier highs near 625 should not be ruled out. History would support this as well - check out the Historical Tendencies section below.
Energy (XLE, -0.67%) and consumer staples (XLP, -0.18%) were the lagging sectors, but strength in the aggressive sectors more than offset this weakness. Furthermore, energy has shown strong relative strength throughout 2016, so a bit of short-term weakness is insignificant technically.
Pre-Market Action
Crude oil ($WTIC) is showing a slight gain this morning while gold ($GOLD) sellers continue their rout. The GLD has very important support at 115. A break and close below that level confirms the re-emergence of its longer-term downtrend in my view.
Dow Jones futures were up 2 points as U.S. equities are flat heading into a relatively quiet morning in terms of earnings and economic news.
The 10 year treasury yield ($TNX) has printed yet another high this morning with the TNX now at 2.29%. The short-term resistance level is close to 2.45% where we could see at least a pause. Clearly, the bond market is anticipating Fed rate hikes in the future.
Current Outlook
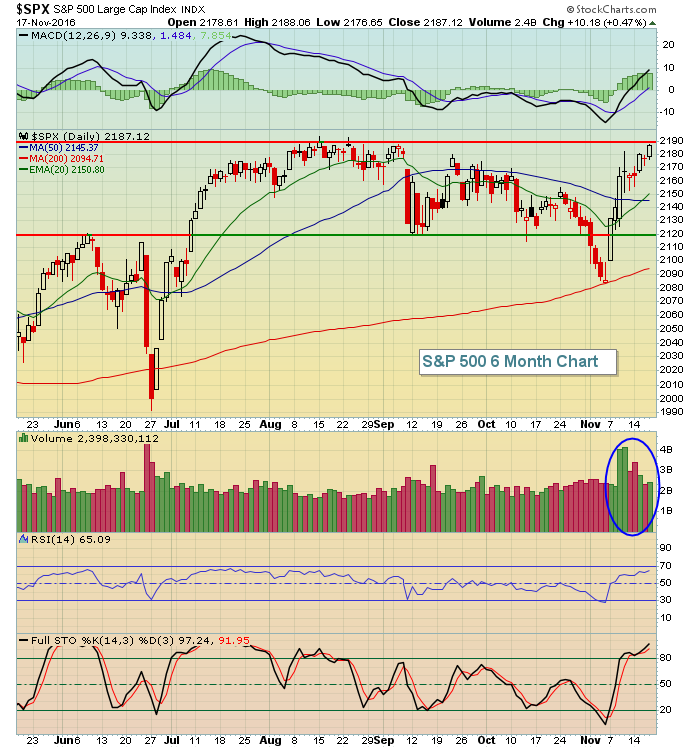
We're about to find out if the bulls are ready to stage another breakout. The highest close on the S&P 500 was on August 15th at 2190.15. Volume that day was just 1.6 billion shares, but of course it was during the slower summer months. Lately, we've seen much stronger volume and Thursday's close was 2187.12, just three points away from an all-time high close.
Here's the chart which certainly shows the resistance crystal clear:
 Volume has been very strong to support this rally and the strength has come from all the right sectors and industry groups. So the bulls have the chance they've been waiting months for - clear all-time high price resistance with gusto. We may find out today if they're ready for the challenge.
Sector/Industry Watch
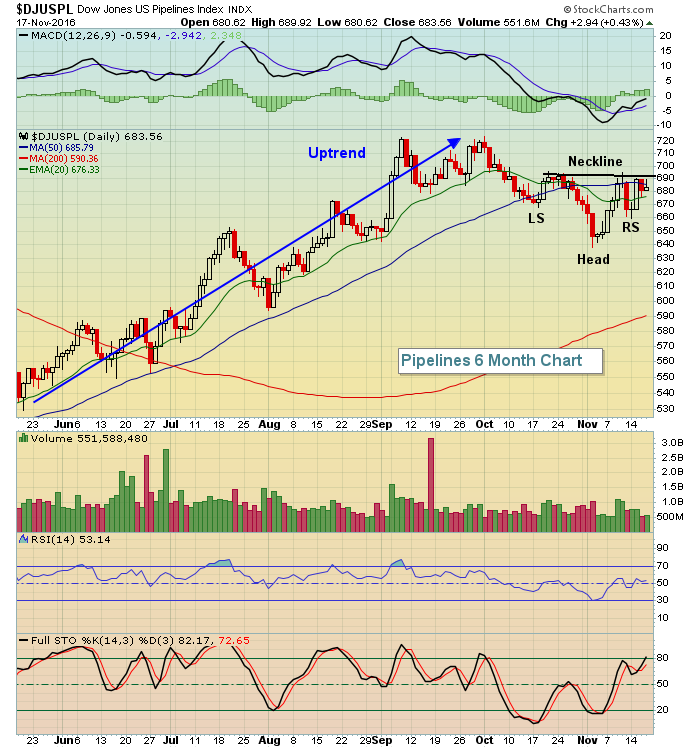
The Dow Jones U.S. Pipelines Index ($DJUSPL) has been very strong throughout most of 2016, but has lagged a bit since early October. Fortunately, however, I see this weakness as an opportunity because there's a bullish inverse head & shoulders pattern that's formed. See what you think:
 A surge in volume to accompany a close above the 690 area would paint a very bullish picture for the pipelines. The measurement of this pattern would be to 740-745.
Historical Tendencies
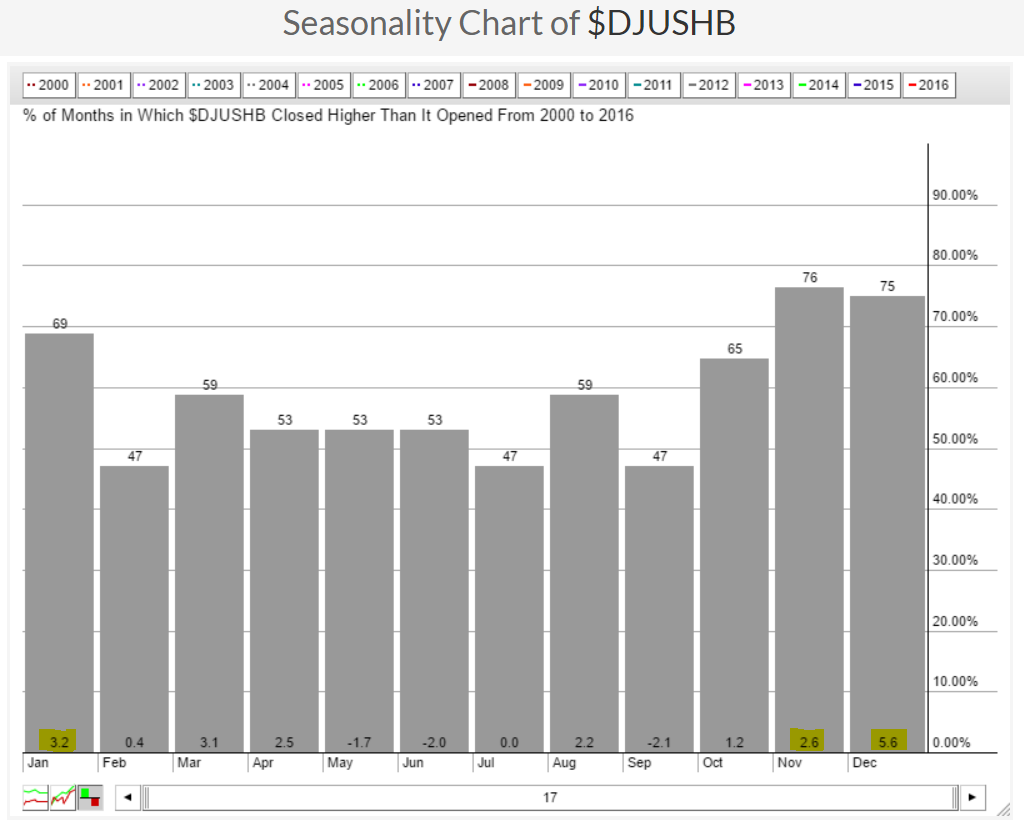
It doesn't seem make sense, but November through January are typically very kind to homebuilding. Check out the following seasonal pattern for the group:
 Both November and December have risen approximately three quarters of the time with average monthly gains of 2.6% and 5.6%, respectively. Action in January is also very bullish historically. Seasonality would definitely favor the bulls over the next two and a half months.
Key Earnings Reports
(actual vs. estimate):
ANF: .02 vs .19
BKE: .48 vs .51
FL: .13 vs .11
TV: .09 vs .16
Key Economic Reports
October leading indicators to be released at 10:00am EST: +0.1% (estimate)
Happy trading!
Tom
