Market Recap for Friday, November 4, 2016
Friday was a rough day for market bulls, especially when you consider how our major indices finished out the week. The S&P 500 was solidly higher at 2pm EST on Friday.....but the last two hours wiped out all gains and we saw the S&P 500 close down for the 9th straight session. Momentum did improve based on the higher hourly MACD reading so today's higher futures shouldn't be a shock. The initial key level of resistance will be 2120 as shown below:
 Consumer stocks were hit particularly hard in those final two hours with both discretionary (XLY, -0.20%) and staples (XLP, -0.90%) finishing below their earlier intraday lows. The XLP was the worst performing sector on Friday. Nondurable household products ($DJUSHN) lost 1.69% and appear to be rolling over after its recent uptrend was broken. Have a look:
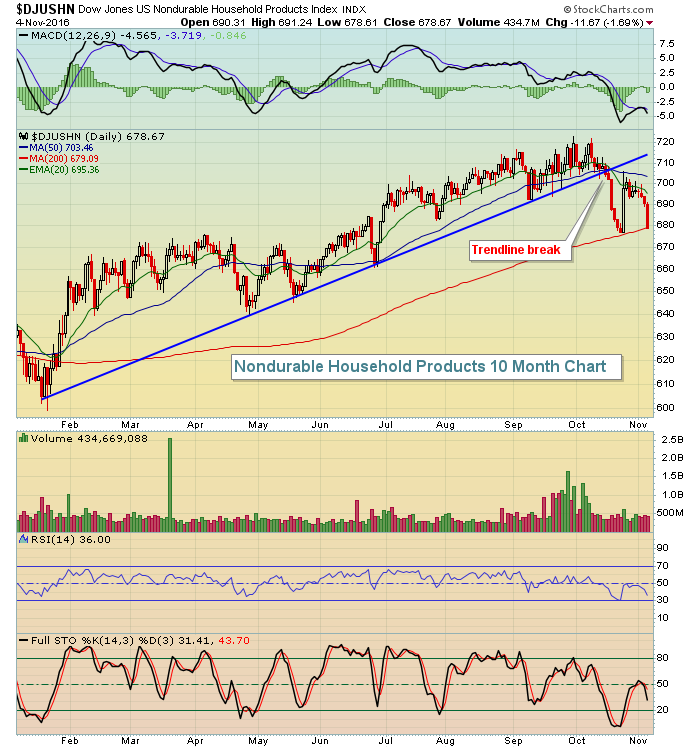 If the DJUSHN loses recent price support at 676, look for a return trip to the post-Brexit low near 660.
Pre-Market Action
U.S. futures are soaring this morning with the Dow Jones set to open higher by 250 points. It's coming at a much-needed time as our major indices suffered technical blows on daily and weekly charts with last week's losses. It's time for the bulls to show their resiliency or face a wrath of sellers in the coming days and weeks.
The dollar is higher, global equities are higher, crude oil is higher and gold is lower after the FBI cleared Hillary Clinton of her use of a private server. Higher U.S. futures are following the lead of global markets where equities have been rallying overnight.
Current Outlook
The bulls will need to show their 7 1/2 year resiliency now that price support at 2120 has been lost on the S&P 500. The reason is simple. Price support was really the only remaining bullish indicator in terms of bull market sustainability. If you look at the most significant gains during the bull market, you'll see that relative ratios favoring aggressive areas of the market performed exceptionally well during those periods. That tells us that market participants are in "risk on" mode, a necessary ingredient of a continuing bull market. Check out this chart:
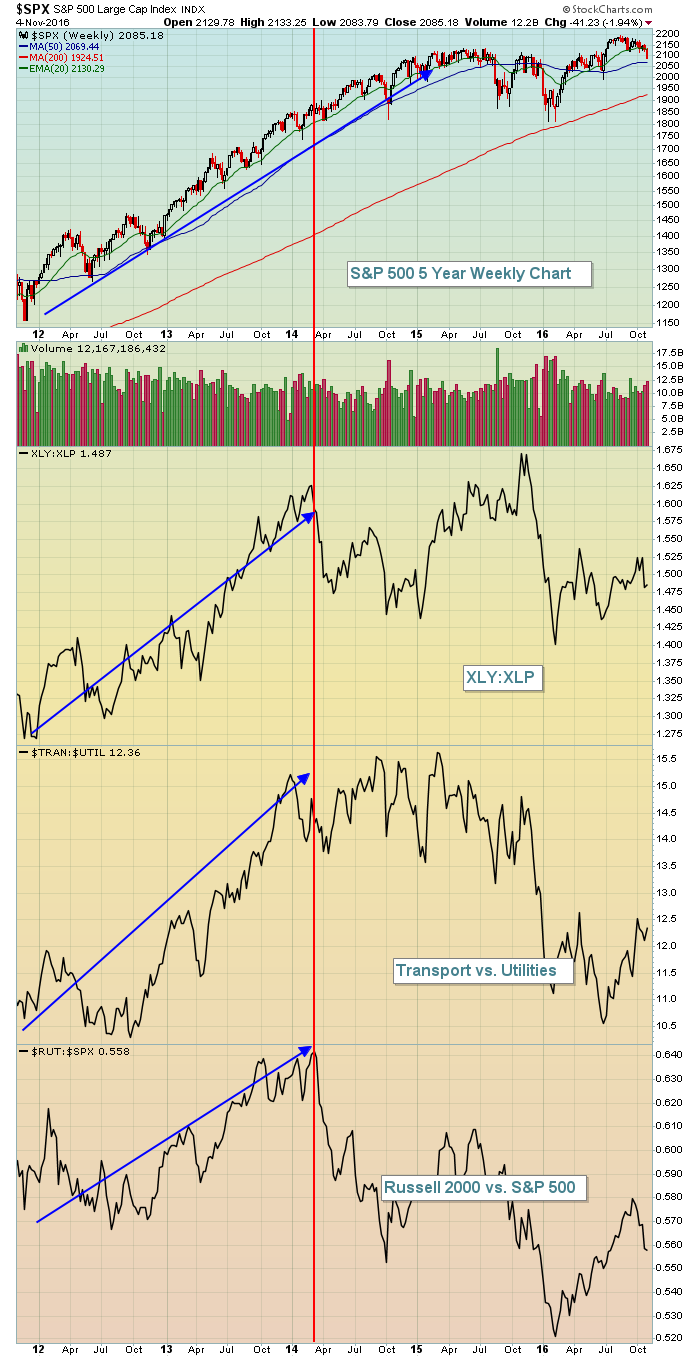 Those blue arrows show that traders remained quite optimistic through early 2014 as the S&P 500 hit 1900, but this last 10% higher in the bull market has been accompanied by rotation into safety and more defensive areas and that's a problem. Now that we're beginning to see price breakdowns, we have to be very careful moving forward.
Sector/Industry Watch
The Dow Jones U.S. Furnishings Index ($DJUSFH) has been very weak since early September but the group has been showing signs of slowing selling momentum. Here's a chart that suggests we'll see further strength in the furnishings area:
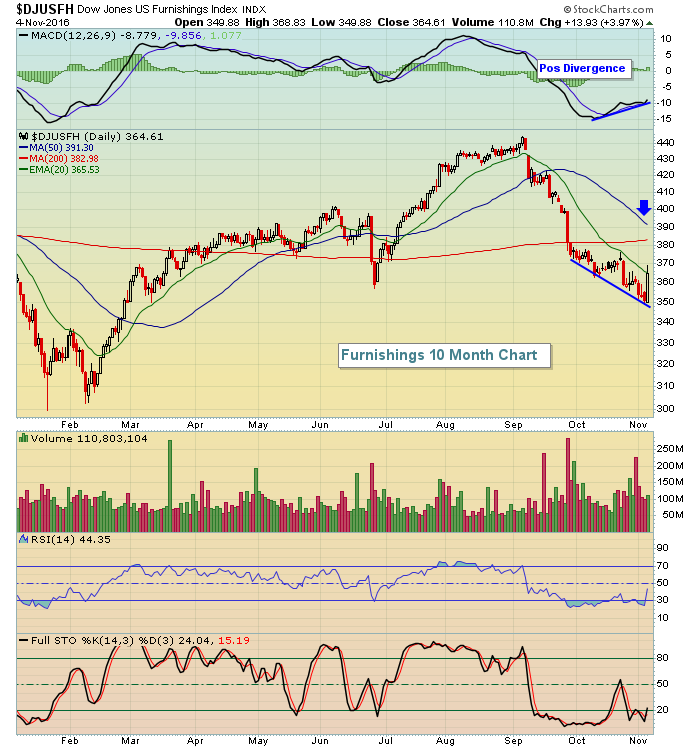 The positive divergence is rather apparent and I look for a MACD centerline reset and possibly a 50 day SMA test (blue arrow). That suggests this industry group could look for another 6-7% upside.
Monday Setups
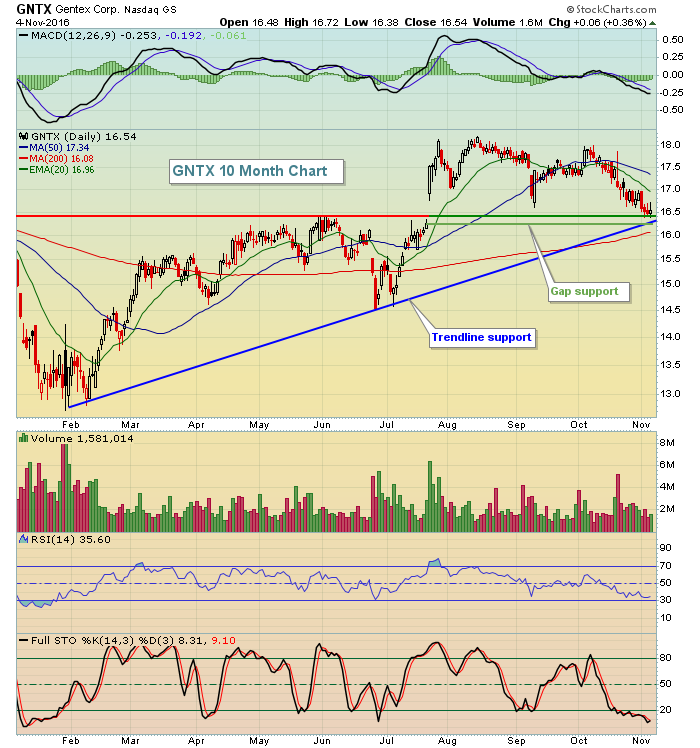
It's difficult to be bullish after last week's breakdowns across our major indices, especially with regard to the S&P 500 that lost key support at 2120, then another level lost at 2100. Long positions can work, even in a downtrend, but the odds lessen. So let me just stress that any positions should be considered very short-term in nature and stops should be honored. With that in mind, Gentex (GNTX) looks to be a prime long candidate as it tests price support and approaches gap and trendline support. Take a look:
 Please join me for my two webinars later today. The first webinar "Bowley Briefing" will be at 12:00pm EST and is FREE to everyone. I'll spend 30 minutes discussing the key technical levels to watch on our major indices and key sectors and industry groups that are in the news technically. Then an hour later at 1pm EST, I'll host "Trading Places LIVE", a very interactive one hour session with StockCharts members. I'll discuss the trade setup above plus at least one or two other trade setups. You do need to be a StockCharts member to access this webinar, but signing up is easy and painless since there's a free trial to get you started. Click on the hyperlinks to register for each webinar and you can CLICK HERE to start your free trial.
Historical Tendencies
The S&P 500 has traded higher 56.6% of November days since 1950, ranking it as the #1 calendar month in this category. The S&P 500 trades higher 53.3% of the time throughout the year.
Key Earnings Reports
(actual vs. estimate):
CTSH: .81 vs .75
FDC: .29 vs .27
GOL: .00 vs (.11)
MGM: .58 vs .08
NSANY: .69 vs .65
RACE: .66 vs .54
ROK: 1.52 vs 1.49
SNI: 1.26 vs .93
SYY: .67 vs .59
(reports after close, estimate provided):
ALB: .81
ALGN: .51
IFF: 1.41
MAR: .90
MCHP: .76
NWS: (.01)
PCLN: 28.40
Key Economic Reports
None
Happy trading!
Tom


