Market Recap for Friday, November 18, 2016
Friday was mostly a day of profit taking - nothing horrible but down nonetheless. Energy (XLE, +0.41%) was able to avoid the downdraft and financials (XLF, +0.00%) broke even, but the other seven sectors finished down, led by healthcare (XLV, -1.06%). Weakness in healthcare was across the board with all of its component industry groups down from 0.89% to 1.30%. Medical supplies ($DJUSMS) was hit the hardest in the space, but it really was not important technically as the DJUSMS continues to consolidate in very bullish longer-term fashion. Check it out:
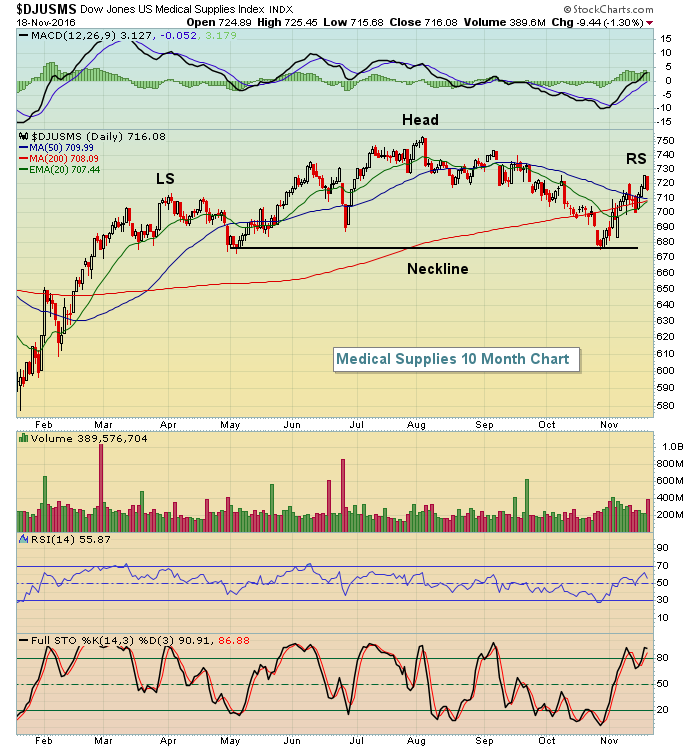 The big problem would surface on a head & shoulders breakdown beneath neckline support. However, recent action has been very bullish with the MACD breaking above centerline resistance and pullbacks holding the rising 20 day EMA. Should that continue, I'd look ultimately for another breakout in the group.
Pre-Market Action
We're about to start a holiday-shortened trading week today as Thursday the U.S. markets will be closed for Thanksgiving Day and Friday will be a shortened trading days with U.S. markets closing at 1pm EST. As we begin the week, U.S. futures are slightly higher with the Dow Jones set to open higher with futures +24 at last check. The key technically will be whether the S&P 500 can close above 2190 at an all-time high.
Most global markets were fractionally higher overnight and this morning so the recent trend higher is likely to continue. One other key factor has been the drop in volatility. The Volatility Index ($VIX) is now down approximately 45% over the past couple weeks and closed on Friday at 12.85. That level reflects a ton of complacency currently and sets the market up for higher prices.
Current Outlook
On Tuesday, November 15th, the 10 year treasury yield ($TNX) closed at 2.24% and on Friday, November 18th, it closed at 2.34%. But during that same four day period, banks ($DJUSBK) moved down slightly from 373.92 to 373.46. Rising treasury yields have undeniably been a primary reason for the surge in bank stocks, but the DJUSBK has failed to follow the TNX higher the past few trading sessions, suggesting to me this group could need a cooling off period. Take a look at the recent correlation:
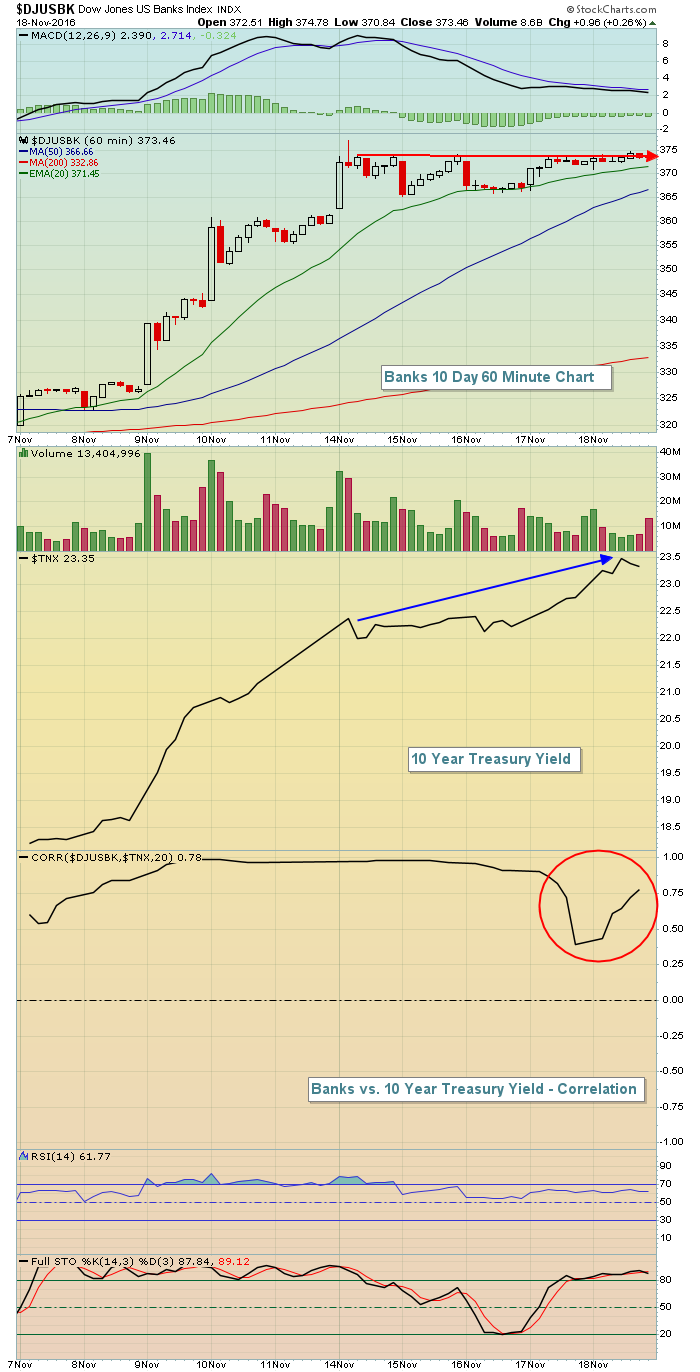 We've seen the TNX rise the last four days while the DJUSBK has stagnated. It's likely risen too far too fast and the slowing momentum on this short-term chart is evidenced by the lower MACD on the DJUSBK at its most recent price high. Given this very short-term slowing momentum, a 50 period SMA test close to 366 is what I'd look for initially.
Sector/Industry Watch
Airlines ($DJUSAR) have literally been soaring of late, but I look for crude oil prices to creep back up above $50 per barrel and that could be enough to stymie airlines in the near-term. Still, now that airlines have recovered and cleared resistance at 250, I do look for a continuing rally - after short-term profit taking. Check out the chart:
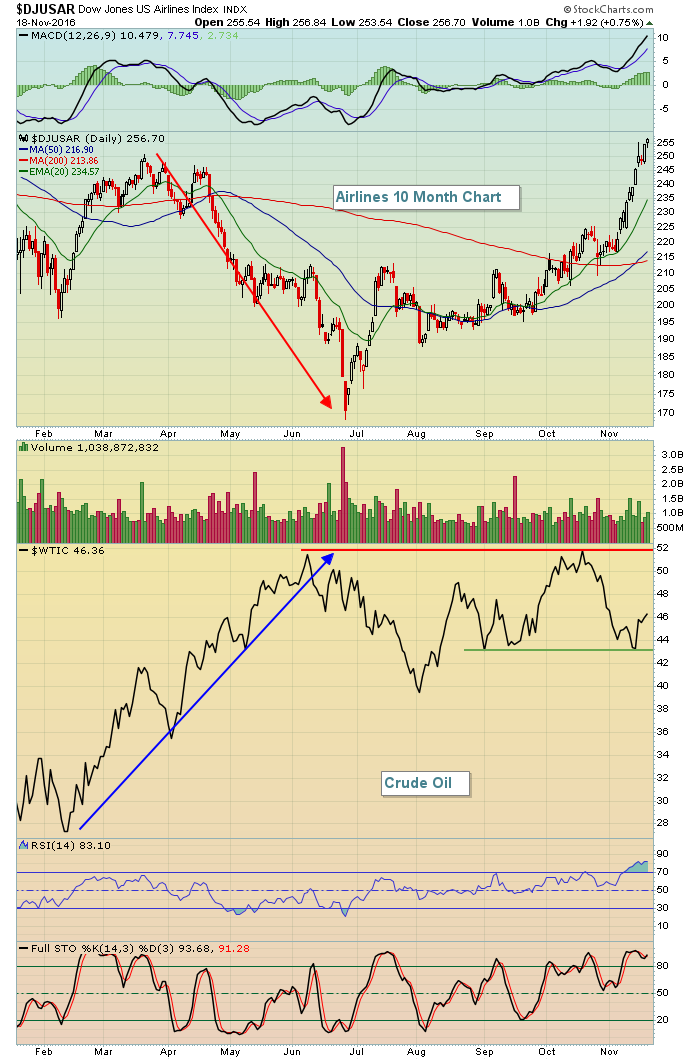 The rising 20 day EMA has been holding as great support over the past two months and I'd look for that to continue. Therefore, to relieve short-term overbought conditions, look for another test of the 20 day EMA, currently at 234.57. You can see that earlier in the year, the shock of quickly rising crude oil prices had a detrimental effect on airlines, but as long as the current rise is subtle, I'd look for the DJUSAR to withstand the short-term bout of selling and push to higher highs later this year and into 2017.
Monday Setups
I have two stocks this week that are at or quickly approaching key support levels and I'll discuss the merits of a short-term trade at my Trading Places LIVE webinar this afternoon at 1pm EST. I'd love for you to join me and you can do so by REGISTERING HERE. A stockcharts.com membership is required for this webinar, however, so please take advantage of the 10 day FREE trial offer.
Two weeks ago, I provided a set up on Gentex (GNTX) and the trade worked out perfectly. Here's the result of that trade:
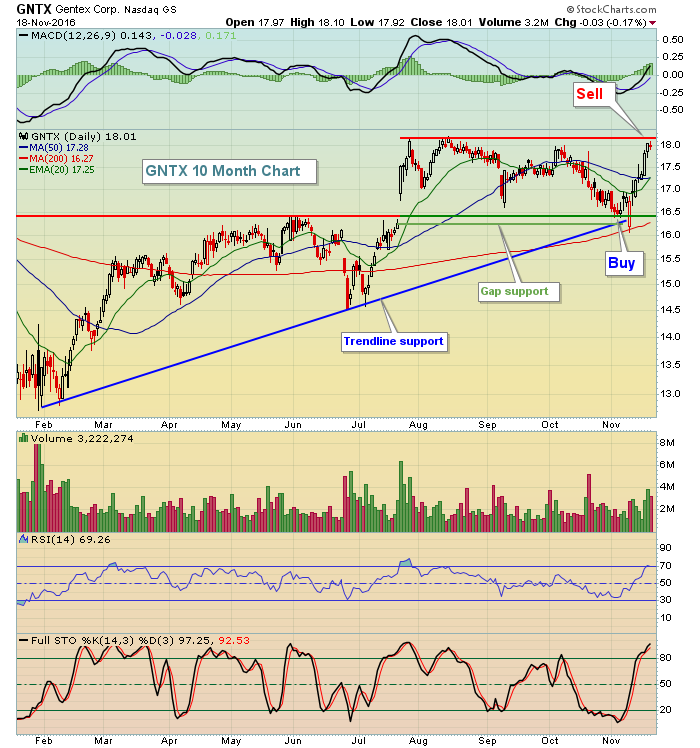 That's a 10% profit in two weeks as price resistance was tested on Friday and exemplifies the virtues of doing your homework, having patience to set up a high reward to risk trade....and then allowing your money to work for you. They don't all work quite this well, but the key is managing your risk on the trade. Join me for my webinar and we'll discuss this in further detail, along with reviewing two new setups for this week.
Historical Tendencies
We are entering a very bullish period for U.S. equities, from now through December 6th. Here are the annualized returns for every calendar day during this period:
November 21 (today): +74.22%
November 22: -27.29%
November 23: +39.48%
November 24: +237.39%
November 25: +39.25%
November 26: +86.37%
November 27: +68.25%
November 28: +53.24%
November 29: +0.43%
November 30: -49.93%
December 1: +80.24%
December 2: +49.51%
December 3: -54.94%
December 4: +61.02%
December 5: +121.14%
December 6: +12.55%
A couple days do show negative returns, but overall the bullish historical bias is fairly obvious over the next two weeks.
Key Earnings Reports
(actual vs. estimate):
IGT: .45 vs .44
TSN: .96 vs 1.24
(reports after close, estimate provided):
BRCD: .17
CPRT: .55
PANW: (.27)
SINA: .19
VIPS: .12
Key Economic Reports
None
Happy trading!
Tom


