Market Recap for Monday, November 21, 2016
It took months, but the S&P 500 finally did what bulls had been hoping for - it closed at an all-time high, breaking above the previous record of 2190. If there was one negative, it was that volume finished below its 50 day SMA. While I don't need to see the heaviest volume on the chart - that historically occurs with selloffs - I do normally like to see above average volume. Can we excuse it since it's during a holiday week where volume is normally lighter? I'm going to because the market rotation has been extremely bullish. First, let's look at the breakout itself:
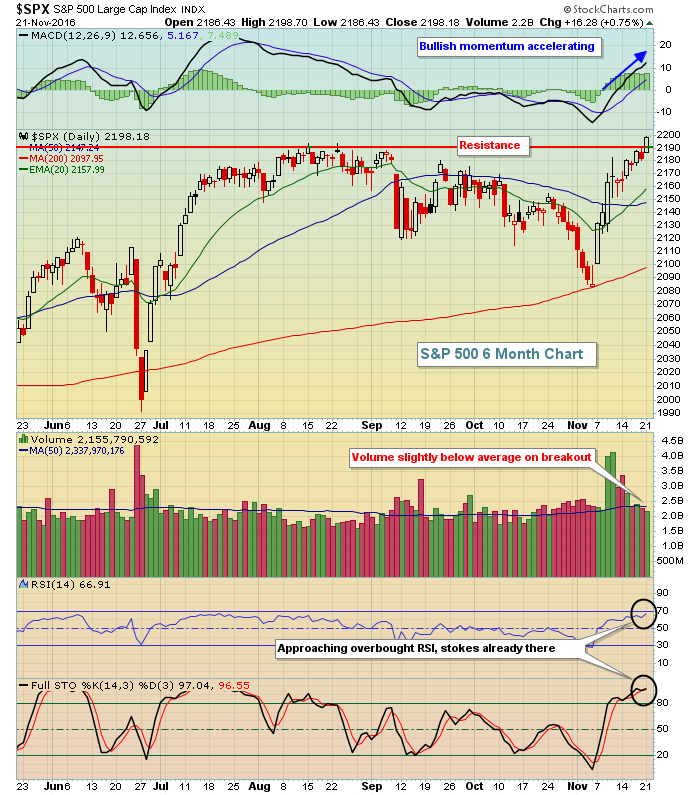 One short-term problem is the short-term overbought conditions. So while I expect to see this rally continue, I do recognize the possibility of a short-term bout of profit taking that could take the S&P 500 back down to test its rising 20 day EMA, currently at 2158. There is no price resistance as we're now in "blue sky" territory with no overhead supply. To the downside, watch 2158.
Energy (XLE, +2.38%) was the big winner on Monday as crude oil prices jumped more than 4%. Materials (XLB, +1.18%) was another key beneficiary as the U.S. dollar ($USD) weakened after the dollar bulls had ridden a 10 day winning streak. The dollar is quite bullish, but yesterday printed a reversing engulfing candlestick that could spell short-term trouble for the greenback. Check it out:
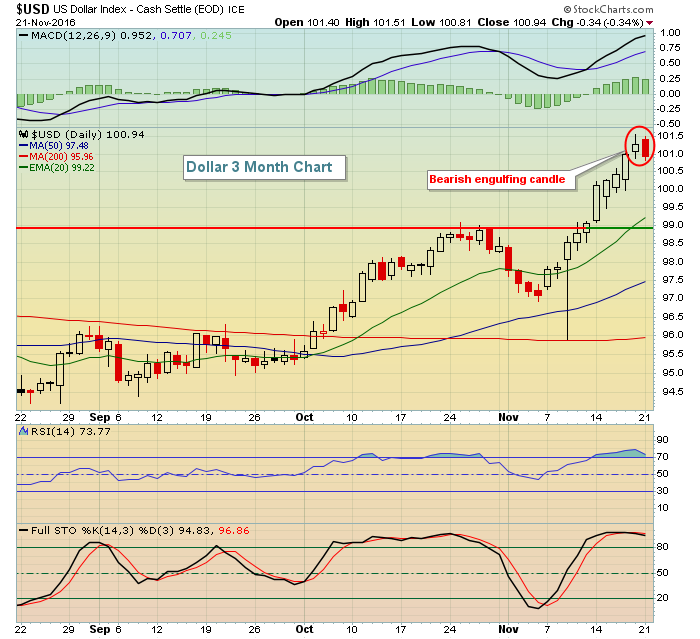 I'd look for short-term weakness in the dollar and if I'm correct, that should provide the catalyst for materials to break out. This sector has been strong, but hasn't yet made its breakout on an absolute basis. Check out the Sector/Industry Watch section below for a closer look at the XLB chart.
Pre-Market Action
Global bullishness continues this morning as key European indices are higher by 0.50%-0.75% and Asian markets also were quite strong overnight, led by the 1.43% advance in the Hang Seng Index ($HSI). China's Shanghai ($SSEC) closed up nearly 1% and closed at its highest level since the first few days of 2016.
U.S. futures are following suit with the Dow Jones futures up 44 points at last check. Crude oil ($WTIC) is taking a breather after a very strong move higher on Monday.
Current Outlook
It's very easy for me to be bullish and to expect higher prices when there are two positive influences. First, we have bullish market rotation with market participants rushing into risk. Second, we have volatility that has fallen to a very low level, indicative that traders fear little. The key there is that the market tends to handle bad news very well if it's complacent like it is now. Since the late June post-Brexit lows, check out the rise in the S&P 500 and the rising and very bullish relative ratios:
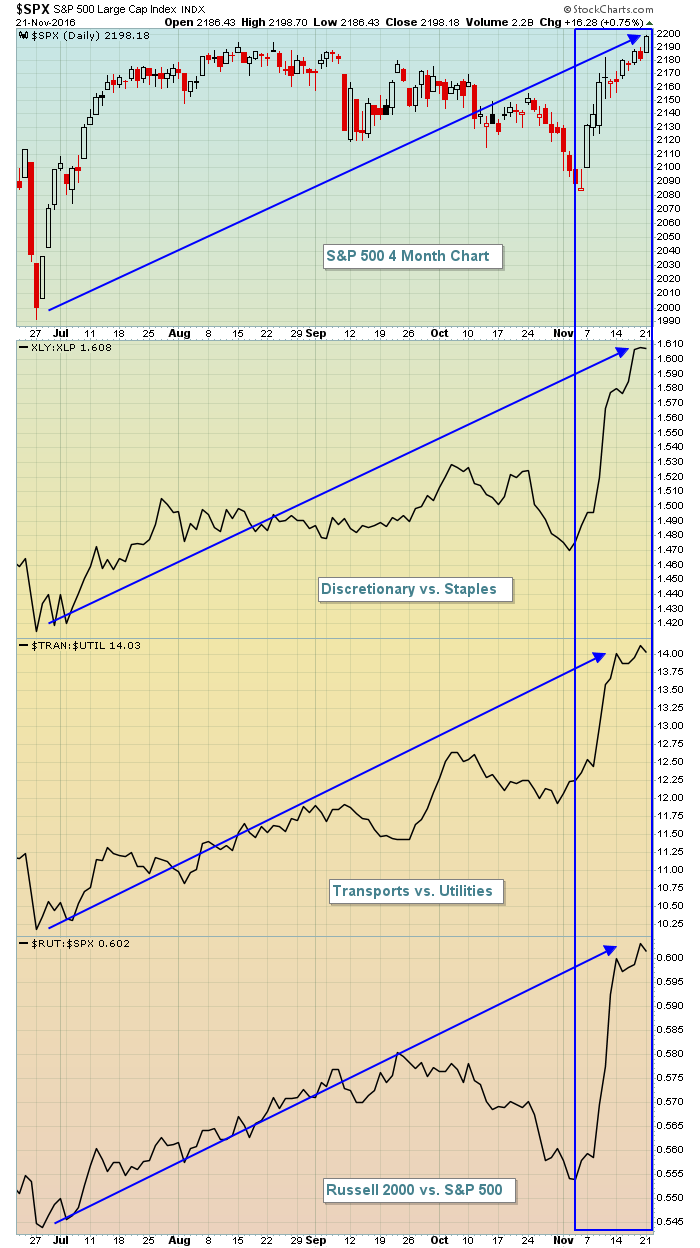 The relative strength in key areas is quite apparent and the blue rectangles highlight the extremely bullish action since earlier this month. While nothing is a guarantee, these are signals that traders are willing to take on big risks and that's normally a recipe for higher prices and the continuation of the current bull market.
Sector/Industry Watch
Materials (XLB) are awaiting their turn for a breakout and, as I pointed out earlier, a possible short-term reversal in the dollar could provide the catalyst. Check out the current technical conditions of the XLB:
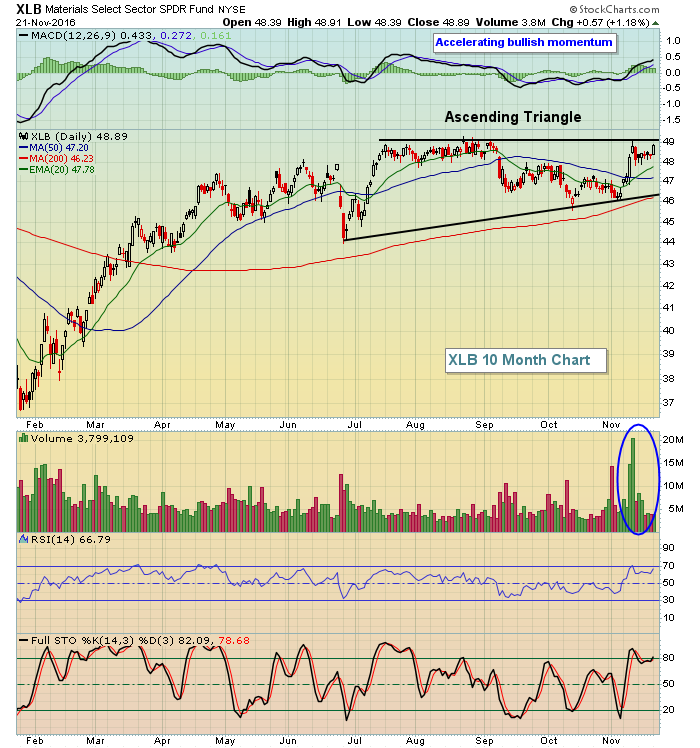 The ascending triangle pattern is a bullish continuation pattern, so I'm definitely watching for a breakout to occur here. Also, my belief that we're continuing a bull market also suggests we'll see wide participation on most corners of the market. I look for short-term leadership from materials with a breakout measuring to 54 on the XLB.
Historical Tendencies
Over the last 66 years on the S&P 500, the Friday after Thanksgiving has risen 48 times and fallen 18 times while producing an annualized return of +86.65%. It has, however, been much less bullish from 2002-2015 where it's risen just 6 times in the last 14 years, producing an annualized return of +10.23%. Still, there's clearly been a bullish bias on the holiday-shortened Black Friday.
Key Earnings Reports
(actual vs. estimate):
ADI: 1.05 vs .89
BURL: .50 vs .33
CPB: 1.00 vs .95
DLTR: .81 vs .78
HRL: .45 vs .46
JEC: .77 vs .77
MDT: 1.12 vs 1.11
PDCO: .56 vs .61
SIG: .30 vs .19
(reports after close, estimate provided):
HPE: .61
HPQ: .36
VEEV: .10
Key Economic Reports
October existing home sales to be released at 10:00am EST: 5,420,000 (estimate)
Happy trading!
Tom


