Market Recap for Thursday, December 15, 2016
With treasury yields on the rise again, it wasn't surprising to see financials (XLF, +0.85%) on top of the sector leaderboard. The problem, however, is that we're beginning to see slowing price momentum on key industry groups - some on daily charts and others on longer-term weekly charts. Both life insurance ($DJUSIL) and banks ($DJUSBK) are printing negative divergences on daily charts, but it doesn't guarantee us that they're topping. Before I get into that, here's the DJUSIL chart:
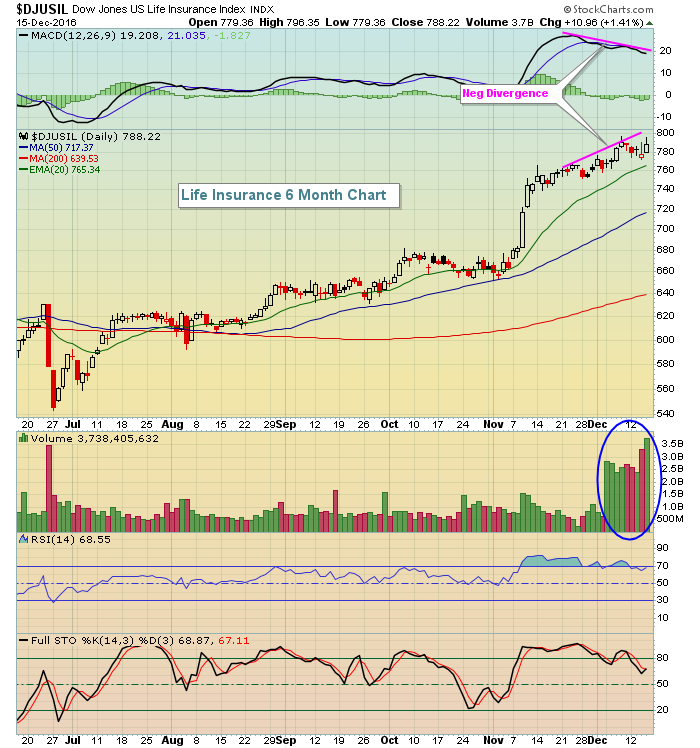 Keep in mind one important thing about the MACD. It only considers price action, not volume. While the volume here looks very heavy, there was a change in how volumes are being calculate, effective December 5th - exactly where the huge volume spikes appeared to occur. You need to check out Arthur Hill's blog article "What's The Deal With That Intraday Volume Spike On The Dow" to read more about the changes that have been made. Volume is a big part of technical analysis so you should understand the changes in order to avoid making incorrect technical decisions and misinterpreting price/volume action.
Despite the volume calculation changes, you can still see that volume was heavy on Thursday relative to prior days. Lower volumes would confirm the slowing price momentum in my view. But because volumes remain heavy, I'd be careful assuming that life insurance has topped based on the daily MACD alone. Finally, if you look at a weekly chart on the DJUSIL, you'll find that weekly momentum is very strong.
Consumer discretionary (XLY, -0.24%) was the only sector to lose ground on Thursday as weakness in clothing & accessories ($DJUSCF), gambling ($DJUSCA) and home construction ($DJUSHB) dragged the group lower.
Pre-Market Action
Global markets ended or are mostly higher this morning. After losing ascending triangle support near $52 per barrel, crude oil ($WTIC) managed to bounce on Thursday after touching its rising 20 day EMA and it's fractionally higher this morning. That 20 day EMA test was vital in my opinion to hanging onto a bullish view on crude. I expect to see oil move higher from here and lead the energy sector to relative outperformance.
Treasury prices are slightly higher this morning with corresponding yields down minimally. The U.S. Dollar Index ($USD) broke out and is really putting a lid on gold ($GOLD), which closed at 1130 yesterday - its lowest close since early 2016. I expect to see higher interest rates, a strengthening dollar and deteriorating gold in 2017.
Dow Jones futures are pointing to a higher open as Dow futures are up 38 points with 30 minutes left to the opening bell.
Current Outlook
I get nervous when I see a large number of negative divergences occurring simultaneously on longer-term weekly charts. Fortunately, that's not the case with the majority of our major indices. It is a problem with the highly influential technology sector and could lead to continuing underperformance from this sector. Certain industry groups within technology are fine technically, but a couple could be primed to struggle for the next few weeks to months. The first is semiconductors ($DJUSSC):
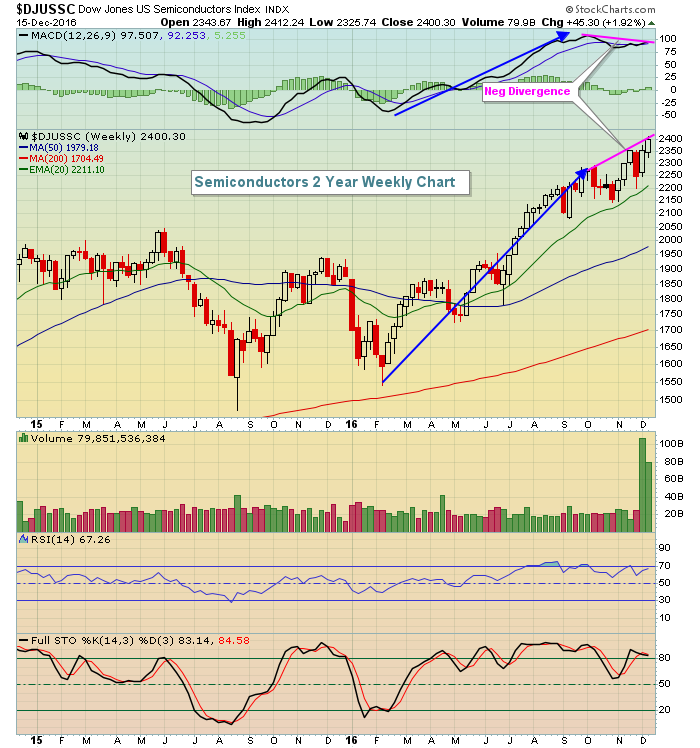 You can see that during most of this advance, the weekly MACD rose right alongside price action. The past couple months, though, have seen price action move higher while the weekly MACD has moved lower. In many instances, this results in weeks, even months, of poor absolute and relative performance. The bulls' hope is that prices remain strong long enough for the MACD to eventually clear its prior high and eliminate the negative divergence. Another key area in technology is featured in the Sector/Industry Watch section below.
Sector/Industry Watch
The Dow Jones U.S. Software Index ($DJUSSW) looks similar to semiconductors. Price action appears fine, moving higher and sailing along. But the short-term 12 week EMA and longer-term 26 week EMA are now converging and that suggests slowing momentum. Have a look:
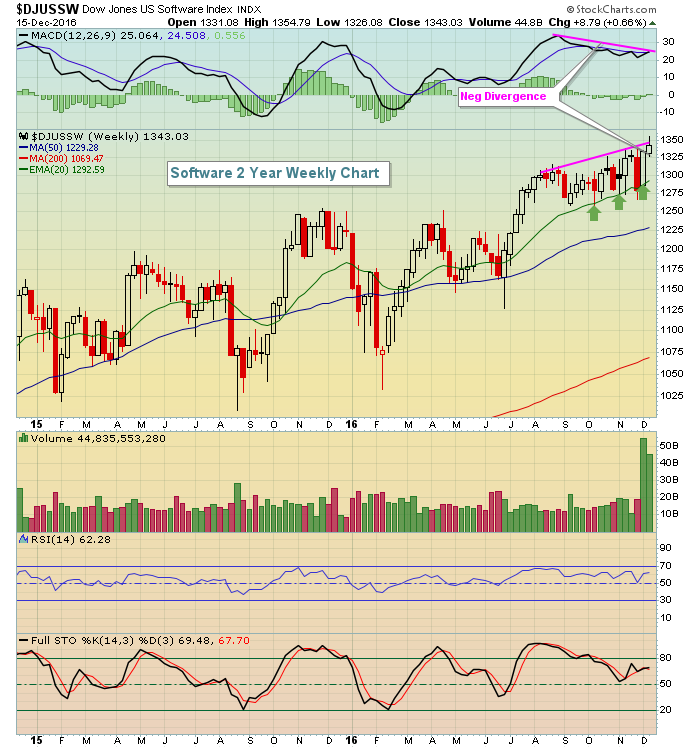 Normal technical behavior sees successful 20 period EMA tests (green arrows) when the MACD is rising along with price. Once that momentum fades in the form of a negative divergence (pink lines), my experience is that those 20 period EMAs begin to fail and I look for 50 period SMA tests to emerge in order to "reset" the MACD back to or near centerline support.
Historical Tendencies
The Dow Jones U.S. Life Insurance Index ($DJUSIL) has been one of the best performing industry groups during the latest bull market run. While much of its strength can be attributed to rising interest rates since June 2016 and the anticipation of further hikes in 2017, this group could also be feeling the positive effects of historical tail winds. Check out the seasonal strength normally experienced in the month of December:
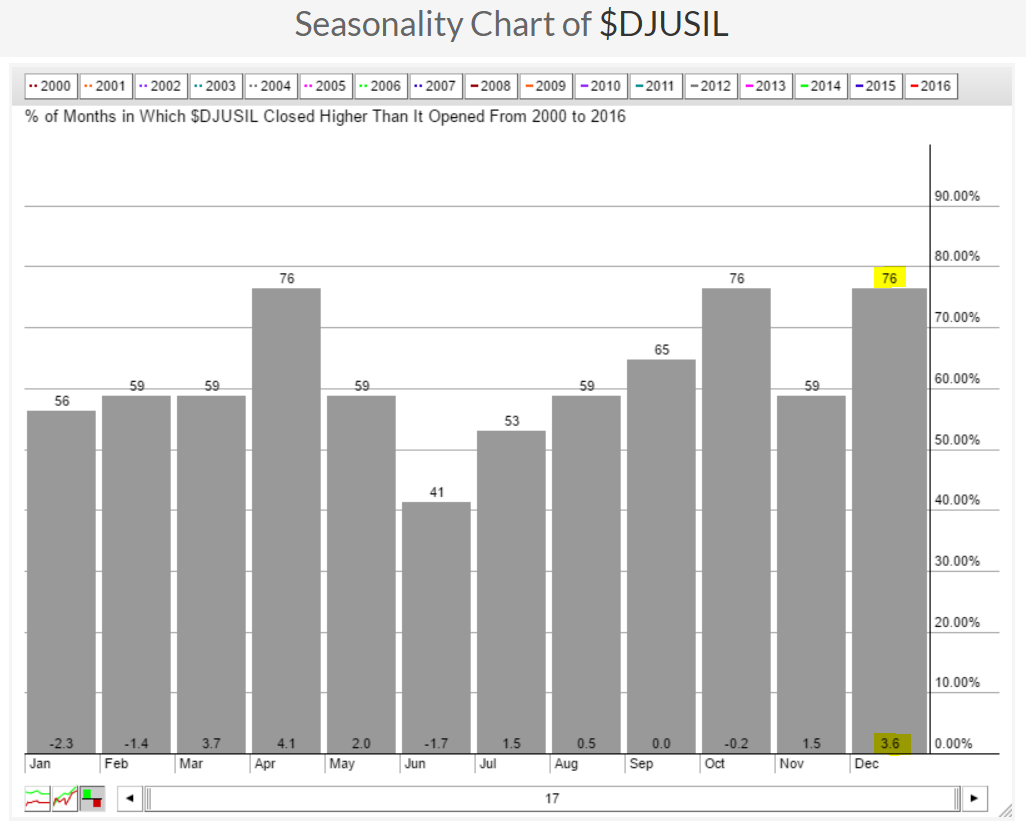 December has ended higher 76% of the last 17 years, the highest percentage among all calendar months. In addition, the average monthly gain of 3.6% ranks behind only April's and March's average monthly gains of 4.1% and 3.7%, respectively.
Key Earnings Reports
None
Key Economic Reports
November housing starts released at 8:30am EST: (actual) vs. 1,230,000 (estimate)
November building permits released at 8:30am EST: (actual) vs. 1,240,000 (estimate)
Happy trading!
Tom


