Market Recap for Friday, May 10, 2019
After another morning of very weak action in U.S. stocks, we saw another afternoon recovery on Friday as all of our major indices finished in positive territory. It certainly felt good, but the truth of the matter is that nothing has been resolved that was feeding into the market's nervousness last week and we're seeing more selling this morning as the weak futures suggest.
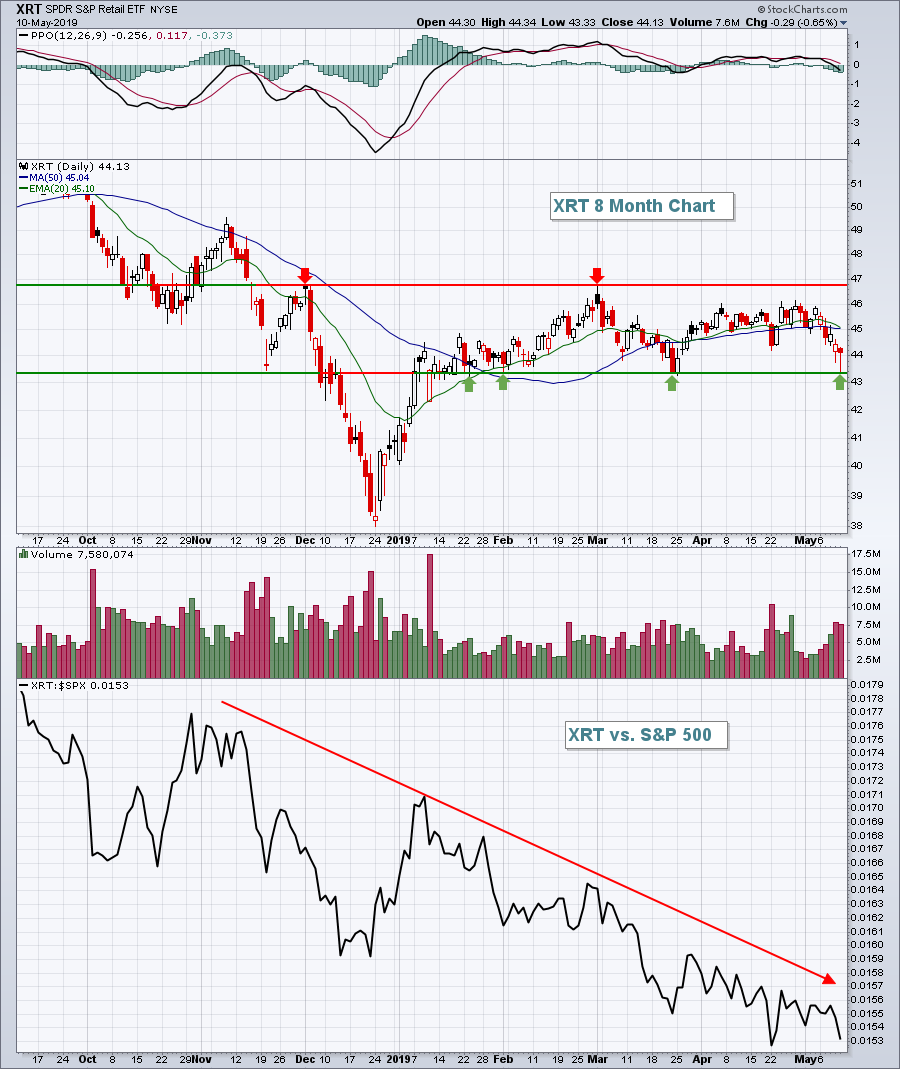
While the big reversal on Friday appeared promising, traders were not committed to it. Utilities (XLU, +1.79%), materials (XLB, +1.36%), consumer staples (XLP, +1.22%), and real estate (XLRE, +1.15%) were the only groups that gained more than 1% with the Friday recovery - none of which are considered aggressive sectors. Instead, those lagged badly, especially consumer discretionary (XLY, +0.15%). Retailers remained quite weak as the XRT threatened its March low:
 This chart doesn't have a very good look. Relative strength has been abysmal throughout 2019 and with this morning's weak futures, we could be looking at an absolute breakdown beneath the 43.30-43.40 level that's been holding as key price support in 2019.
Broadline retailers ($DJUSRB, -0.10%), one of the brighter retail areas in 2019, were unable to get back into positive territory or clear their 20 day EMA, despite the afternoon rally.
Pre-Market Action
China has retaliated in the U.S.-China trade war, raising tariffs on $60 billion worth of goods effective June 1st. Global markets are reeling on the news with Europe lower across-the-board with the German DAX ($DAX) leading the weakness, down 173 points or 1.44% at last check. Dow Jones futures were down 500 points as our major indices appear poised to test last week's lows at this morning's opening bell.
Current Outlook
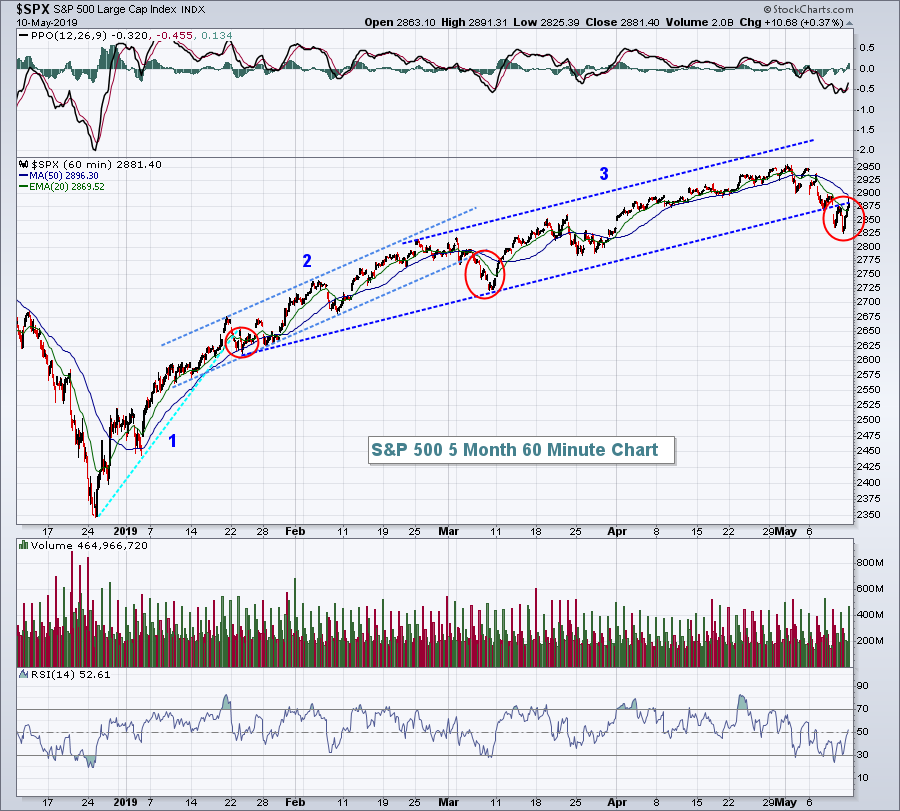
After a cyclical bear market, the bullish recovery goes through an evolution. We start out with a hyper recovery and uptrend that is unsustainable due to the slope of the trendline. From late-December through early-January, the S&P 500 gained 13-14% in less than a month. That trendline won't hold because an entire index is not going to climb at that rate for very long. Then we move into another phase where the uptrend continues strongly, but again the slope is not sustainable over an intermediate-term period. And so on and so forth. Here's a visual of what I'm referring to:
 Last week's action appears to changing the pattern once again. We need to allow the selling to play out to determine the likely trajectory of the remaining trendline for 2019. I believe we'll end up connecting the March 8th low with the ultimate low in this period of selling. Maybe the low is already in, but futures are weak once again so this week's action will provide us further clues.
Sector/Industry Watch
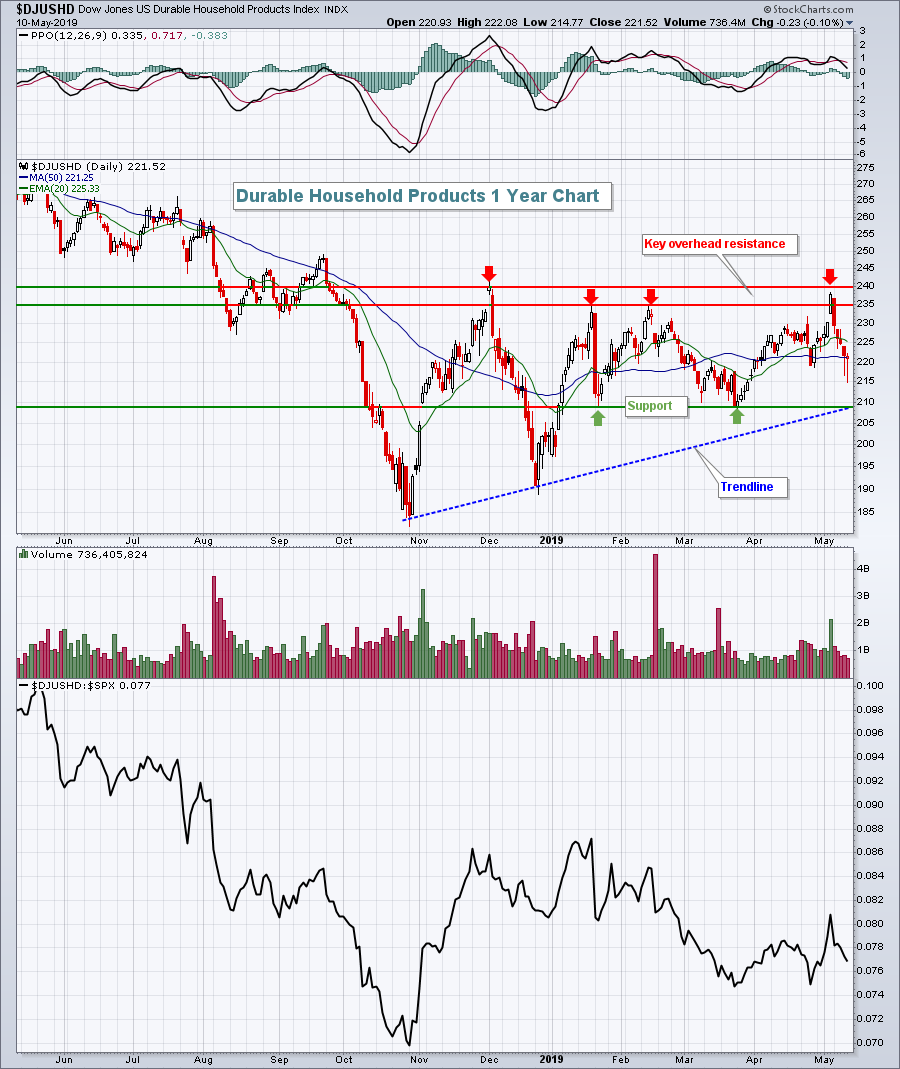
The Dow Jones U.S. Durable Household Products Index ($DJUSHD, -0.10%) recovered very nicely on Friday, as did the overall market. The DJUSHD has a lot of questions to answer on its chart, however. Check it out:
 Trendline and price support intersect near 210 and that needs to hold given the overall relative downtrend in the group. No excuses here. To the upside, it's clear to me that 235-240 has marked resistance on several occasions. For the bulls, this level needs to be cleared to build on the relative strength enjoyed the past several weeks.
Monday Setups
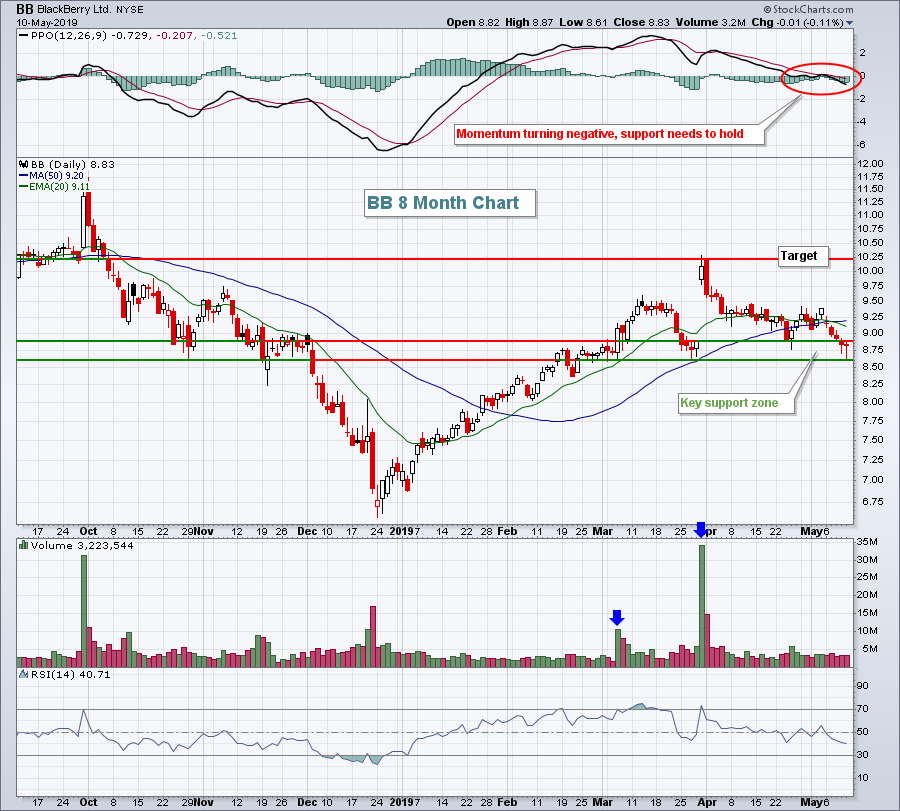
Sometimes, I like certain stocks better than others simply because of their relative strength or their industry's relative strength. Other times, it just comes down to reward to risk. This week, I'm going with the latter. After gapping higher and trading above 10.25 on extremely heavy volume (nearly 35 million shares), BlackBerry Ltd (BB) has worked its way back to both gap and price support. It's technical do-or-die for BB, in my opinion:
 While there are obviously no guarantees as to a positive trading outcome here, managing risk on trades helps to avoid big losses. I believe BB is worth the risk at the current price level.
To view a few other trade setups for this week, CLICK HERE.
Also, if interested, I'm providing EarningsBeats.com a couple charts each week for their FREE newsletter. This morning, I provided a chart of a life insurance company that rose 85% from November 19th to February 19th while the S&P 500 rose just 3% and I highlighted some key attributes that I used to select it as one of my Top 10 Picks on November 19th, just before its ascent. To sign up and check out this chart, CLICK HERE.
Historical Tendencies
Small caps are looking forward to the end of May. May 26th through June 5th represents one of the strongest periods of the year for small cap stocks. Since 1987, this 10 day period has produced annualized returns of +65.41%.
Key Earnings Reports
(reports after close, estimate provided):
BILI: (.13)
LM: .52
MIME: .09
STNE: .16
STE: 1.44
TME: .10
TTWO: .77
Key Economic Reports
None
Happy trading!
Tom


