Market Recap for Tuesday, May 14, 2019
We've seen little economic or earnings news of late and that's beginning to show in the randomness of the huge S&P 500 moves based on President Trump's tweets regarding US-China trade. Sometimes it's simply rumors swirling that's been taking center stage. In any event, the swings have been dizzying and yesterday was another example as the Dow Jones gained more than 200 points, bouncing off the price support established in March:
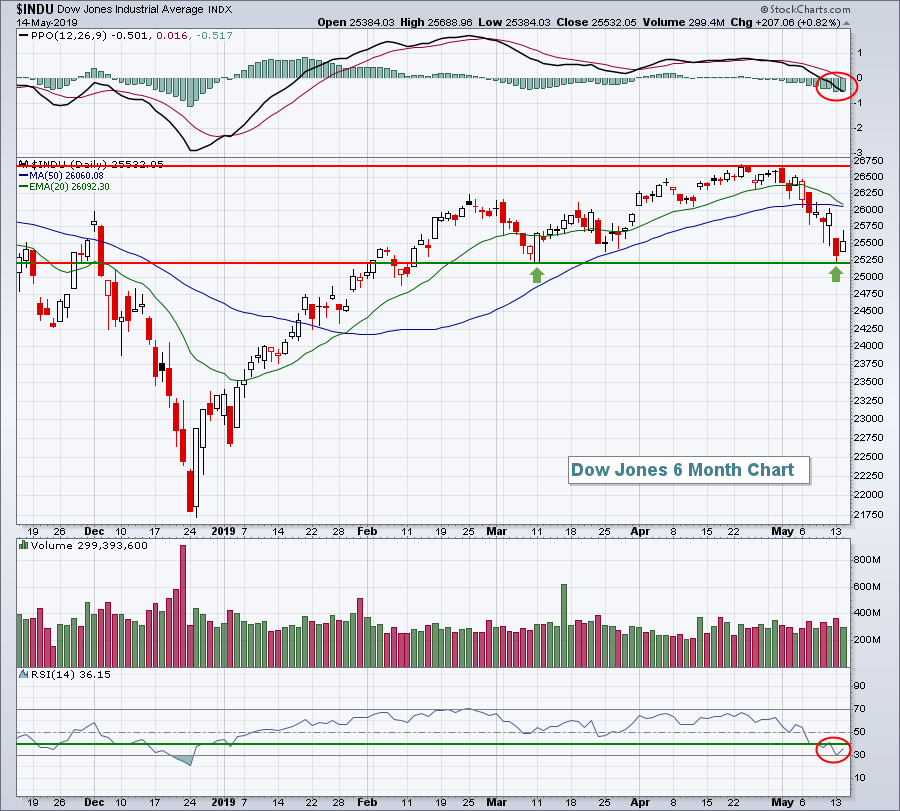 An RSI reading that tests 30 and a daily PPO that crosses into negative territory is not what we typically see when the stock market is trending higher. This suggests to me that we've entered a period of consolidation at best....and the start of a downtrend at worst. One sign that will help us determine which is whether key support levels at March hold. Why is the March support level so important? Well, high volatility ($VIX) bottoms typically mark significant support levels in our major indices. Losing those levels typically leads to increased volatility and lower lows. Here's a chart to illustrate:
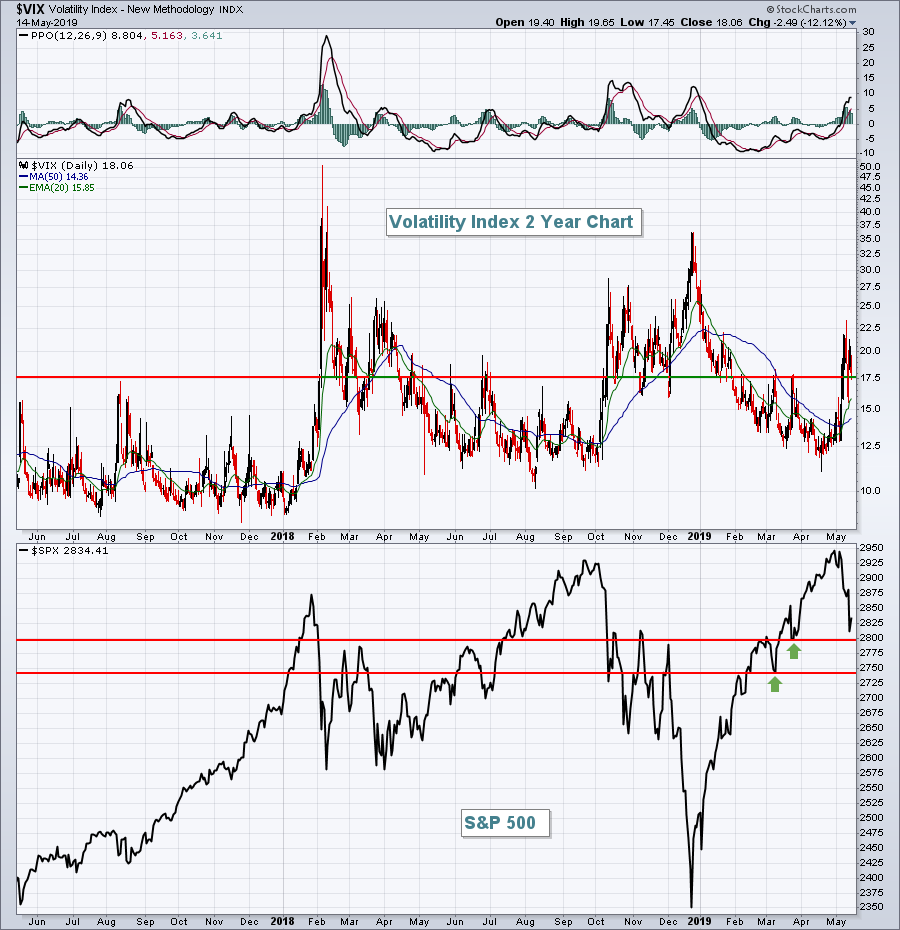 Any VIX reading that hits 17-18 or above has typically gone on to mark short- to intermediate-term bottoms in the S&P 500. The next key closing support level on the S&P 500 would be near 2800 and that's just below the 20 week EMA (not pictured above). That's an important level to watch as well.
It was encouraging to see leadership from areas like technology (XLK, +1.61%), industrials (XLI, +1.04%), and consumer discretionary (XLY, +1.01%), but failure to build on intraday gains in the final two hours on Tuesday underscores the nervousness that remains in the stock market.
Pre-Market Action
Asian markets overnight seemed to gain relief from the U.S. stock market gains on Tuesday, aiding a recovery there. However, European indices have turned much more defensive this morning and that's being reflected in further U.S. weakness. Dow Jones futures are lower by 175 points with 30 minutes left to the opening bell.
The 10 year treasury yield ($TNX) has tumbled another 5 basis points to 2.37%, threatening to move to fresh 2019 lows. That's significant as it highlights traders' insistency on owning defensive treasuries.
April retail sales were a big disappointment this morning, coming up well short of expectations, and that's reflected in both weak U.S. stock futures and a sinking 10 year treasury yield. The bulls will be hoping the day ends better than it starts.
Current Outlook
When pessimism builds in the U.S. stock market, price support levels are important to watch, but key sentiment levels are also important to watch. I discuss the Volatility Index ($VIX) frequently, but it's important to also see how aggressively bearish options traders have become. The best way to follow this is the equity only put call ratio ($CPCE). When this ratio spikes, it tells us that more equity puts are being traded relative to equity calls. In other words, individual stock traders are believing that prices have only one way to go - down! That line of thinking normally suggests we're at or approaching a significant bottom:
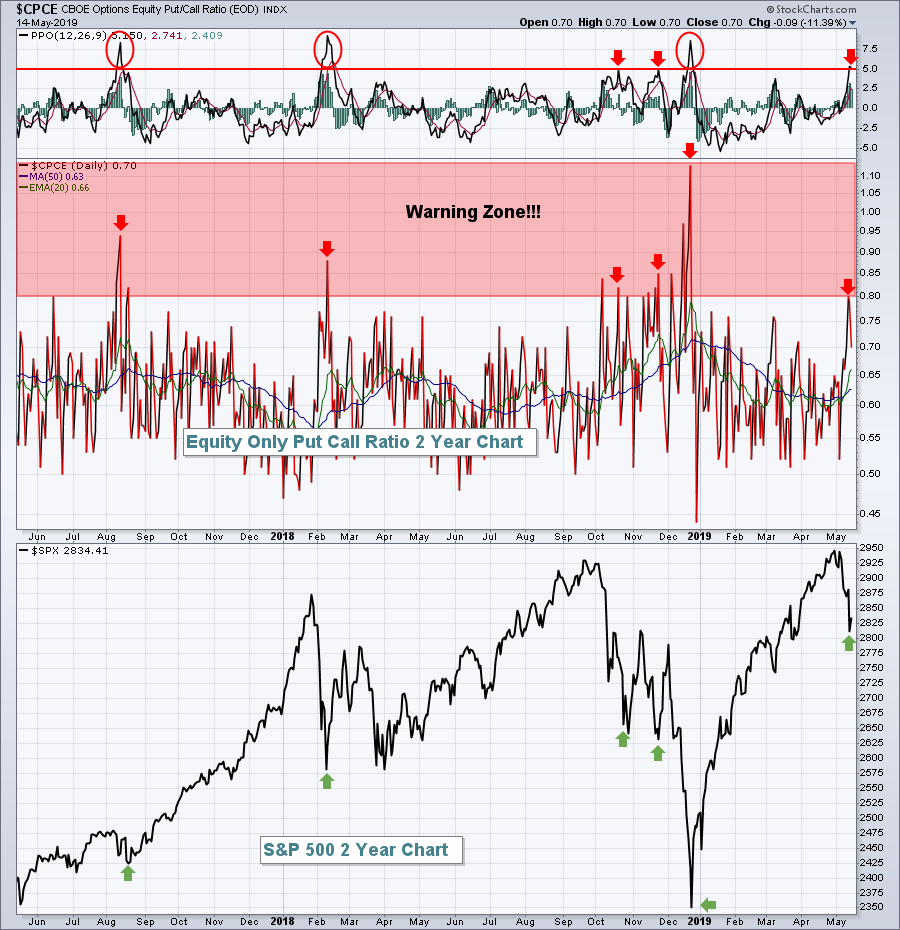 While it's likely that we've at least seen a temporary bottom, December 2018 is a reminder that we could see the pessimism build once again. The point here is that shorting after a big decline and a huge spike in bearish sentiment is very often a losing proposition. A sudden and sharp rebound will cause many of those put options to lose tremendous value quickly and emotions take over. Any time you trade with emotion, you're in big trouble. Market makers prey on emotional traders.
Sector/Industry Watch
Apparel retailers ($DJUSRA, +0.76%) moved higher off the December bottom, but still underperformed the benchmark S&P 500 throughout much of that rally. Given the recent negative divergence and subsequent break below both 50 day SMA and PPO centerline support levels, this has become a group to avoid:
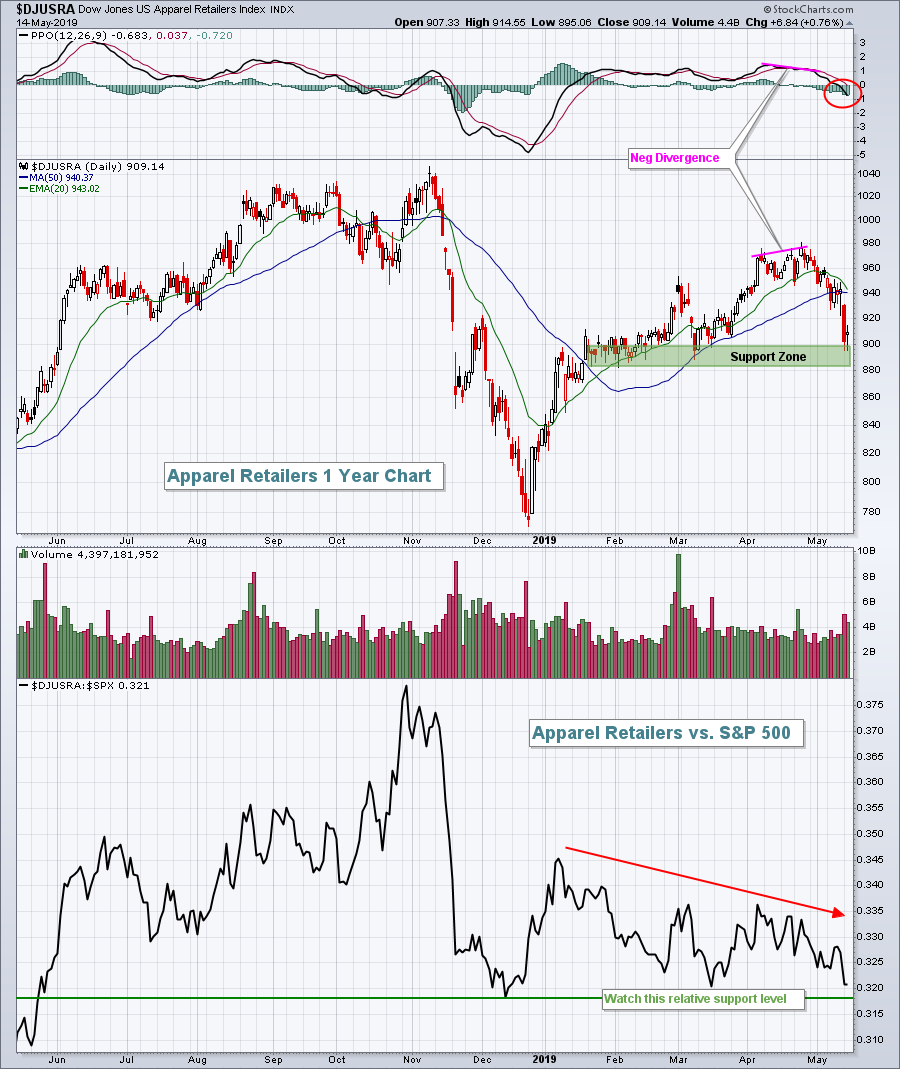 Honestly, there's not much to like about this chart. But I'd focus on two areas. First, price support in the 880-900 range (green shaded area) has held on multiple occasions. Closing below that area would be another bearish development. The second line to watch is the relative support level. A break below that support line would be telling us that money continues to rotate away from apparel retailers and that makes the task of finding outperforming apparel retailers very difficult to find.
Historical Tendencies
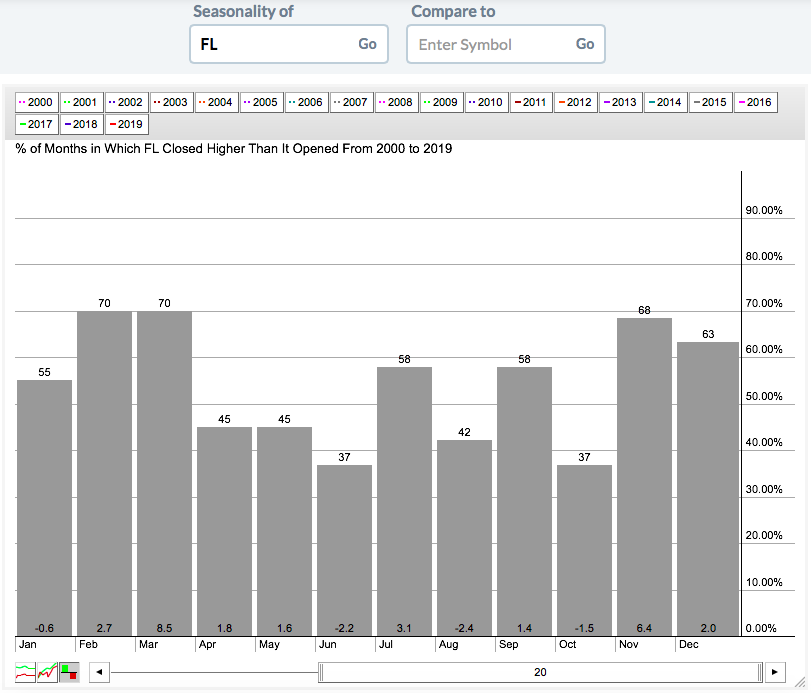
Foot Locker (FL) has averaged gaining 20.8% the past 20 years, but has averaged losing 1.5% over the summer months of June through August. The overall market tends to slow in the summer, but FL's weakness is noteworthy:
 I mention this because apparel retail ($DJUSRA) has been struggling vs. the benchmark S&P 500 (as illustrated in the Sector/Industry Watch section above) and FL has begun to show characteristics of a downtrending stock:
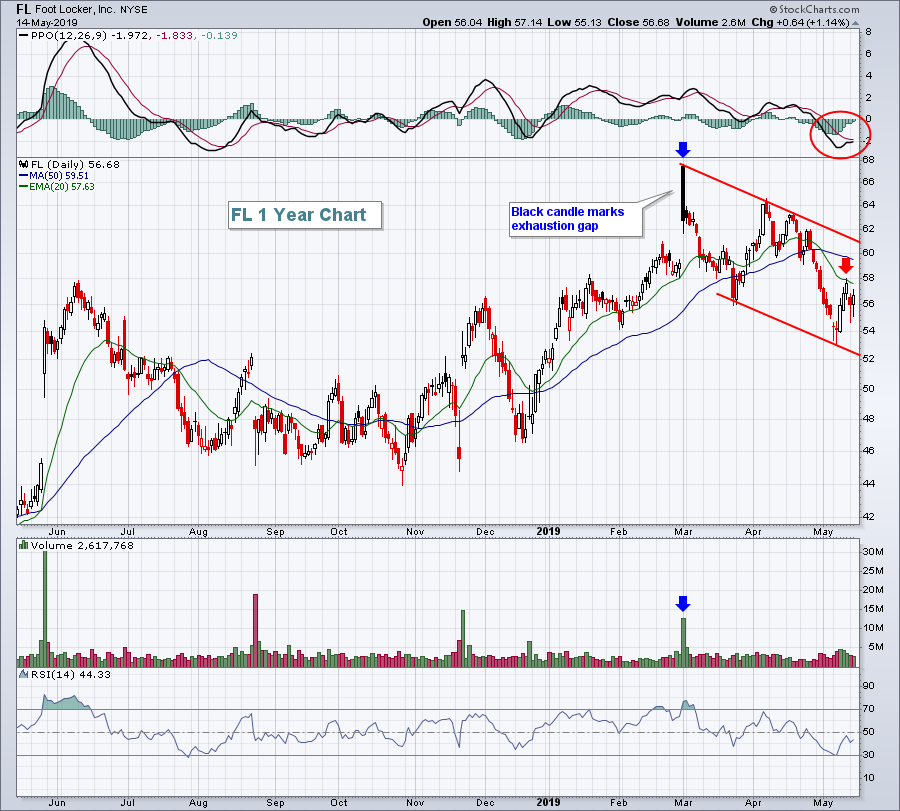 I'd be very careful with FL and apparel retail until we begin to see more bullishnessness take place on their respective charts.
Key Earnings Reports
(actual vs. estimate):
BABA: 1.28 vs 1.05
M: .44 vs .36
(reports after close, estimate provided):
CSCO: .77
FTCH: (.17)
NTES: 1.86
UGP: .03
ZTO: .19
Key Economic Reports
April retail sales released at 8:30am EST: -0.2% (actual) vs. +0.2% (estimate)
April retail sales less autos released at 8:30am EST: +0.1% (actual) vs. +0.7% (estimate)
May empire state manufacturing survey released at 8:30am EST: 17.8 (actual) vs. 9.0 (estimate)
April industrial production to be released at 9:15am EST: +0.0% (estimate)
April capacity utilization to be released at 9:15am EST: 78.7% (estimate)
March business inventories to be released at 10:00am EST: +0.1% (estimate)
May housing market index to be released at 10:00am EST: 64 (estimate)
Happy trading!
Tom


