Market Recap for Wednesday, May 15, 2019
Falling treasury yields put a lid on many industries within financials (XLF, -0.37%), while renewed strength in the U.S. Dollar Index ($USD) kept pressure on materials (XLB, -0.26%). Other than those two sectors, it was primarily a very bullish day. The NASDAQ was the best performing index, gaining 1.13%. There was fairly wide participation, however, as the S&P 500, Dow Jones, and Russell 2000 climbed 0.58%, 0.45%, and 0.34%, respectively. Leadership was felt in communication services (XLC, +2.24%), technology (XLK, +1.09%), and a host of consumer areas. Consumer staples (XLP, +0.79%) and consumer discretionary (XLY, +0.68%) added strength, despite an abysmal retail sales report for April. In fact, a plethora of poor economic reports resulted in the 10 year treasury yield ($TNX) falling 4 basis points to test its March low at 2.36%.
Relative strength in key aggressive sectors is still strong, although there was short-term damage inflicted during the recent trade-war-related selloff:
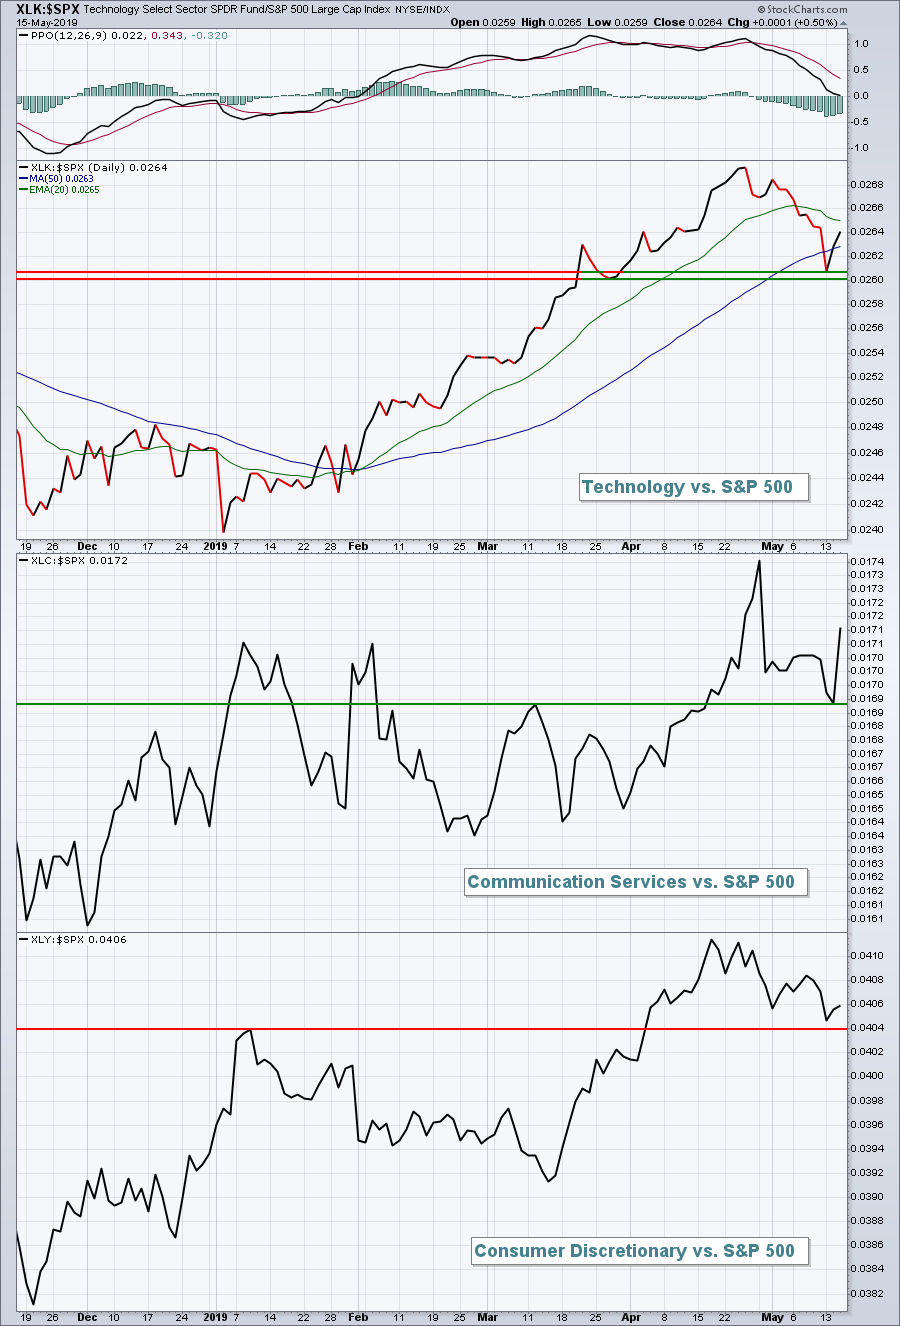 Keep an eye on those relative strength support levels. Given the high volatility ($VIX) and increase in the equity only put call ratio ($CPCE) recently, I believe the odds are high that we've seen a solid short- to intermediate-term bottom print in our major indices. If the above relative strength support lines fail to hold, that would be a signal that my call is incorrect.
Internet stocks ($DJUSNS, +3.39%) were strong on Wednesday, leading the XLC higher. But there's work to do on this chart if the group continues pushing higher today:
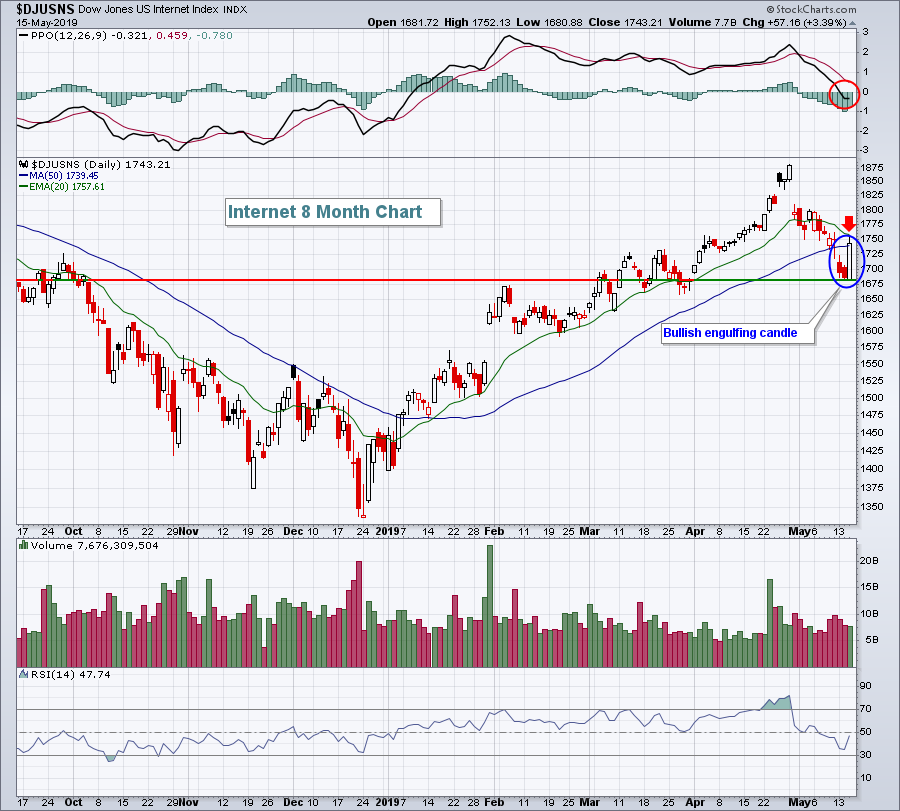 The reversing candle is nice, but it's a short-term signal only. Can we move back through the now-declining 20 day EMA? The PPO has turned negative so that 20 day EMA test will be significant technically.
Pre-Market Action
The 10 year treasury yield ($TNX) has climbed back to 2.40% this morning on the heels of much better economic news and that should help to provide a lift to the financials in particular.
Dow Jones futures suggest a continuation of the recent U.S. equity advance, climbing 95 points with 30 minutes left to the opening bell. Europe is strong this morning as well, so momentum is at the back of the bulls - at least to start the day.
The VIX has declined 4 of the last 5 days and a close beneath 16 would be a signal that the worst is likely over. Nothing is a guarantee, especially given the trade war. We know one headline could mean 500 points on the Dow Jones. The sentiment environment no doubt has improved, though, and that should be viewed as a positive for equities.
Current Outlook
I'm not exactly sure what to make of the financials' relative strength (XLF:$SPX) on this potential double bottom in the 10 year treasury yield ($TNX):
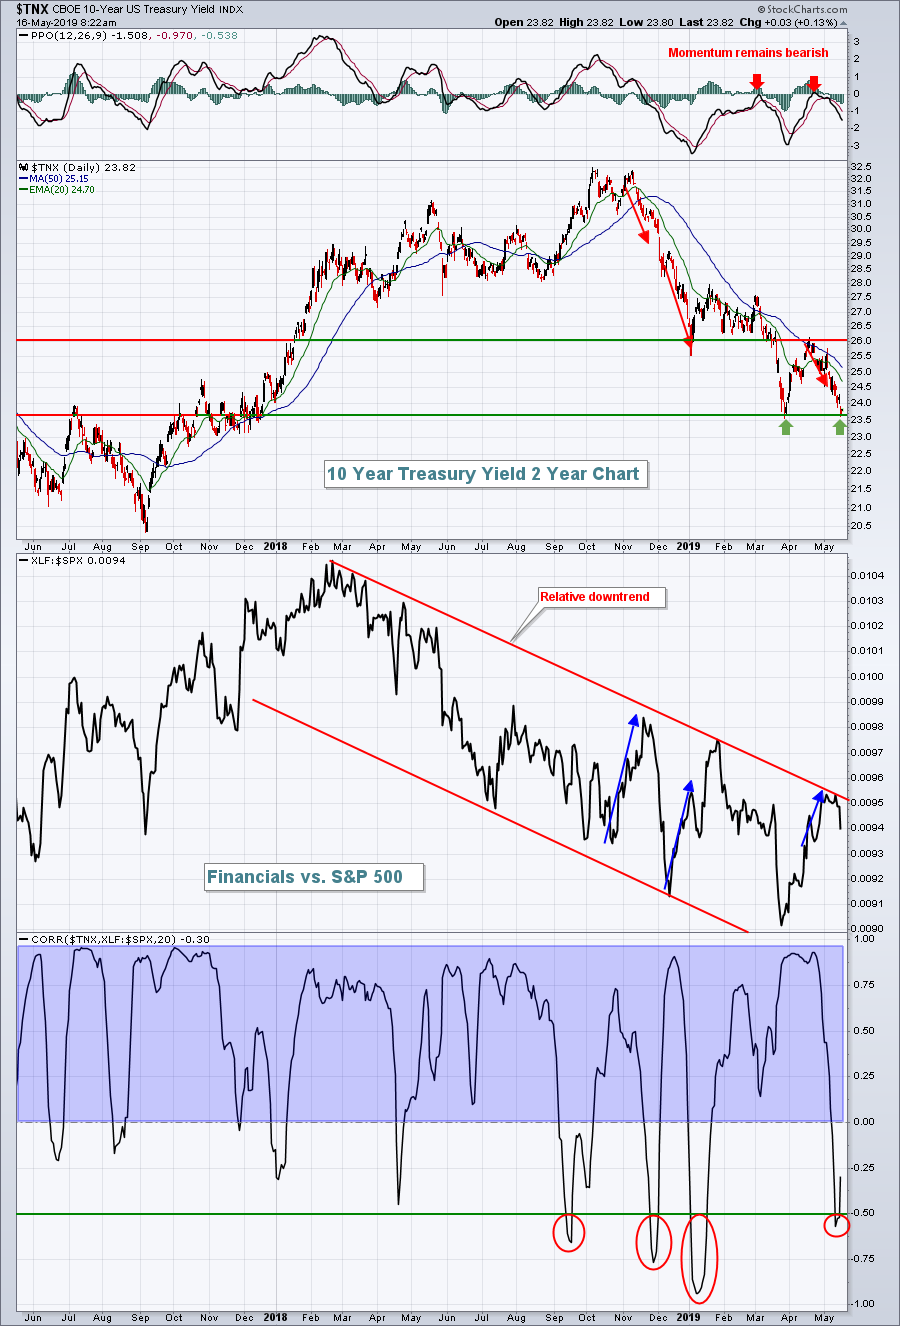 Correlation tells us that the relative strength of financials is highly dependent on the direction of the TNX. The four exceptions where they moved opposite one another are highlighted above. The last two times we've seen the TNX move lower while financials outperformed on a relative basis did not end well for the XLF. It appears as though we're beginning to get a repeat. The XLF:$SPX ratio is turning lower after testing relative trendline resistance. There is hope though. The TNX retested its March low. If the TNX turns higher off of this 2.36% low, let's watch to see if the XLF can break out of its downtrend vs. the benchmark S&P 500.
Sector/Industry Watch
Banks ($DJUSBK, -1.00%) are underperforming once again and it's easy to understand why. The 10 year treasury yield ($TNX) has fallen 8 basis points this week to 2.38% and falling yields pressure net interest margins at banks. The TNX has tested its March low, however, while the DJUSBK remains well above its March low. It could be a good signal that a bottom has been established. But further technical confirmation would be holding the 2019 uptrend line:
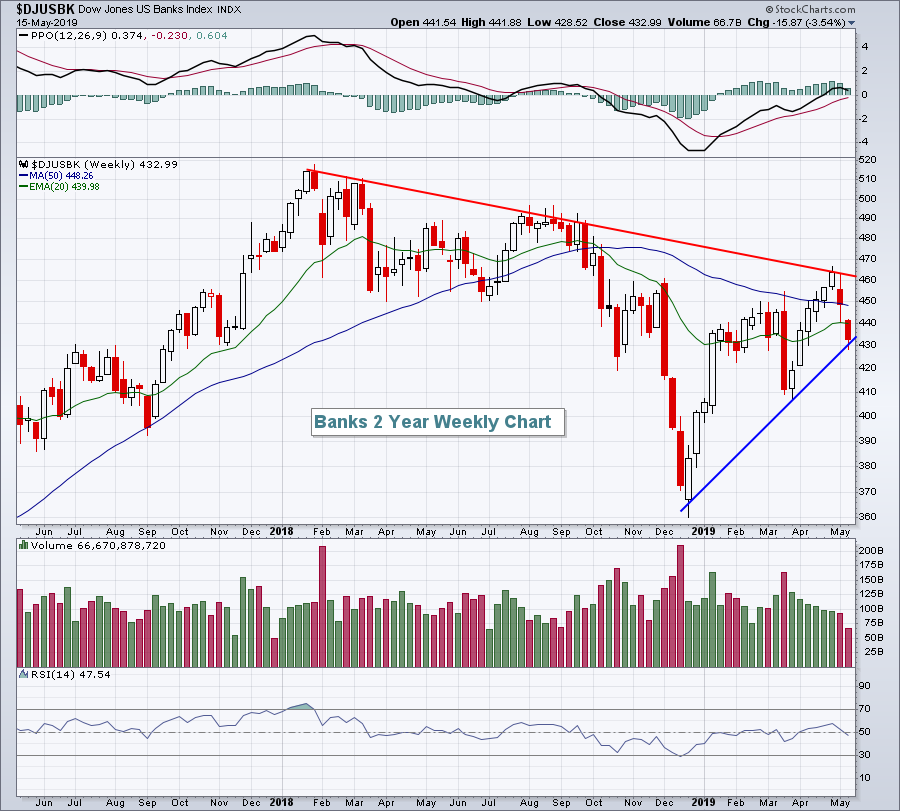 Failure to do so would suggest more selling ahead and a likely test of the March price low near 410. Multiple tests of the downtrend line should be monitored during any future rally. Breaking that downtrend ultimately would be very bullish for banks, but that would likely require a much weaker treasury market (ie, higher treasury yields).
Historical Tendencies
Financials are approaching their worst calendar month of the year - at least over the past two decades:
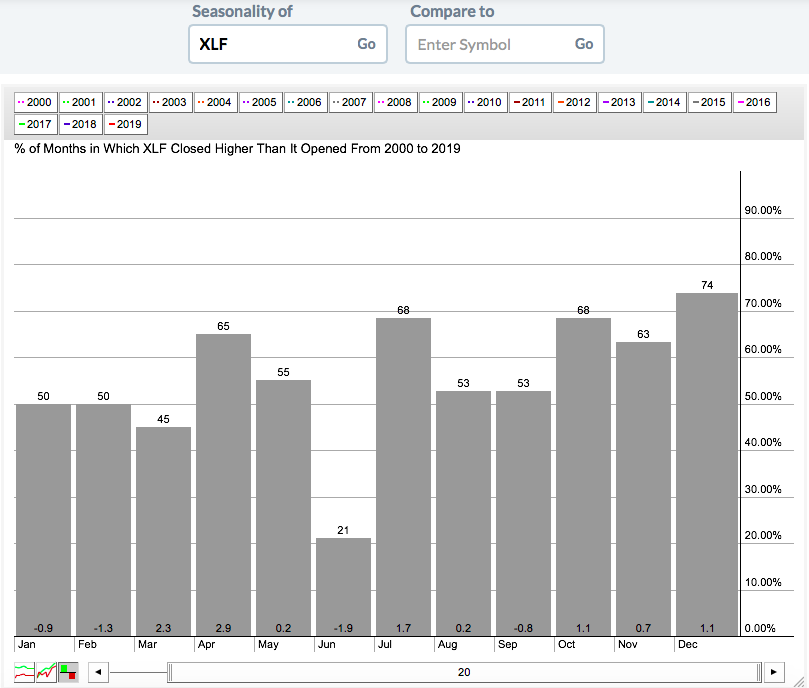 The XLF has only risen 21% of Junes this century and its average monthly return of -1.9% is easily the worst of the year. Seasonality would argue that the negative correlation discussed earlier in the Current Outlook section will ultimately be resolved with further relative deterioration in financials.
Key Earnings Reports
(actual vs. estimate):
EXP: .87 vs .78
NICE: 1.18 vs 1.11
TV: .05 vs .09
WIX: .03 vs .09
WMT: 1.13 vs 1.02
(reports after close, estimate provided):
AMAT: .66
BIDU: .41
IQ: .52
LTM: .10
NVDA: .82
PINS: (.09)
Key Economic Reports
Initial jobless claims released at 8:30am EST: 212,000 (actual) vs. 219,000 (estimate)
April housing starts released at 8:30am EST: 1,235,000 (actual) vs. 1,200,000 (estimate)
April building permits released at 8:30am EST: 1,296,000 (actual) vs. 1,290,000 (estimate)
May Philadelphia Fed survey released at 8:30am EST: 16.6 (actual) vs. 9.3 (estimate)
Happy trading!
Tom


