Market Recap for Wednesday, June 5, 2019
The good news is that the U.S. stock market advanced on Wednesday and that both the Dow Jones (+0.82%) and S&P 500 (+0.82%) were able to clear their respective declining 20 day EMAs. Another piece of good news is that 10 of the 11 sectors advanced with only energy (XLE, -1.11%) down for the day as crude oil ($WTIC, -3.37%) took another big hit:
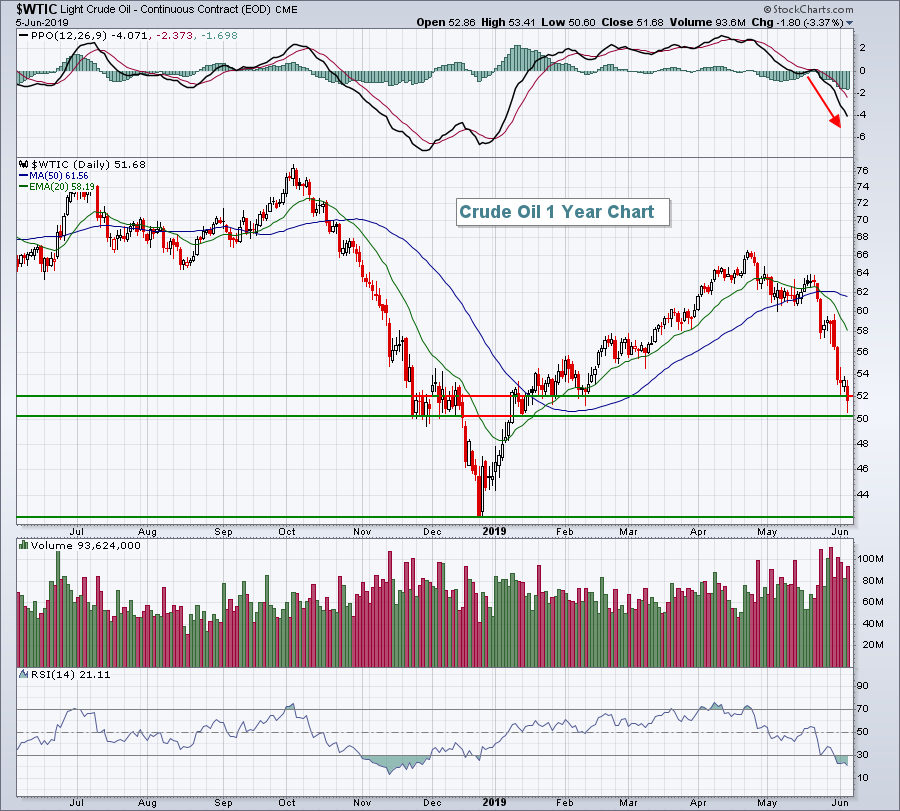 The $50-$52 per barrel range appears to be significant short-term support and we are bouncing off this area in early morning trade. Failure to hold this level, however, would likely lead to a test of the December low in the lower-40s. The XLE would likely be much lower if it weren't for the falling U.S. Dollar Index ($USD) over the past week. Materials (XLB, +0.73%) and energy both tend to show relative performance vs. the benchmark S&P 500 that moves inversely to the USD.
The leadership in defensive sectors was obvious on Wednesday and there's more detail on this in the Sector/Industry Watch section below. In addition, another not-so-great story from yesterday was the performance of small caps. The Russell 2000 did not participate in the advance, dropping a point on the session.
Telecommunications equipment ($DJUSCT, +2.34%) was one very bright spot in technology (XLK, +1.30%) as it held off sellers at price support once again, this time breaking back above 20 day EMA resistance. Clearing 1400 would be a huge deal for this group:
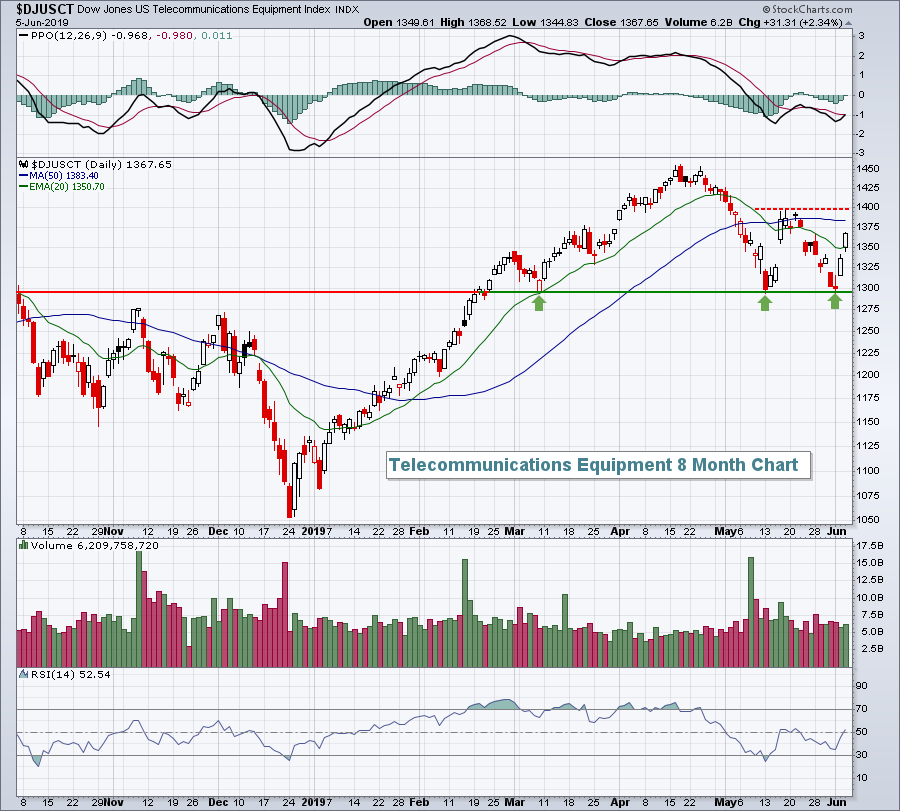 Cisco Systems (CSCO, +2.86%) was a big reason for the group's rise, and it was also the best perfoming component in the Dow Jones.
Pre-Market Action
The 10 year treasury yield ($TNX) is down 3 basis points this morning and just below the 2.10% level. Crude oil prices ($WTIC) have stabilized, even if only temporarily, and are currently trading up close to 1% and just above $52 per barrel. Gold ($GOLD) continues to rise, up $8 to $1341 per barrel. I see GOLD potentially rising to challenge multi-year price resistance close to the $1375 per ounce area. Longer-term, I'm bearish gold. But short-term fundamentals have improved as the Fed considers lowering interest rates. The TNX has taken a decidedly lower move vs. the 10 year German treasury yield ($DET10Y) over the past several weeks and that typically coincides with a weaker dollar. Gold historically moves opposite the dollar.
In Asia overnight, China's Shanghai Composite ($SSEC) made a significant breakdown, closing back below 2850 for the first time since February:
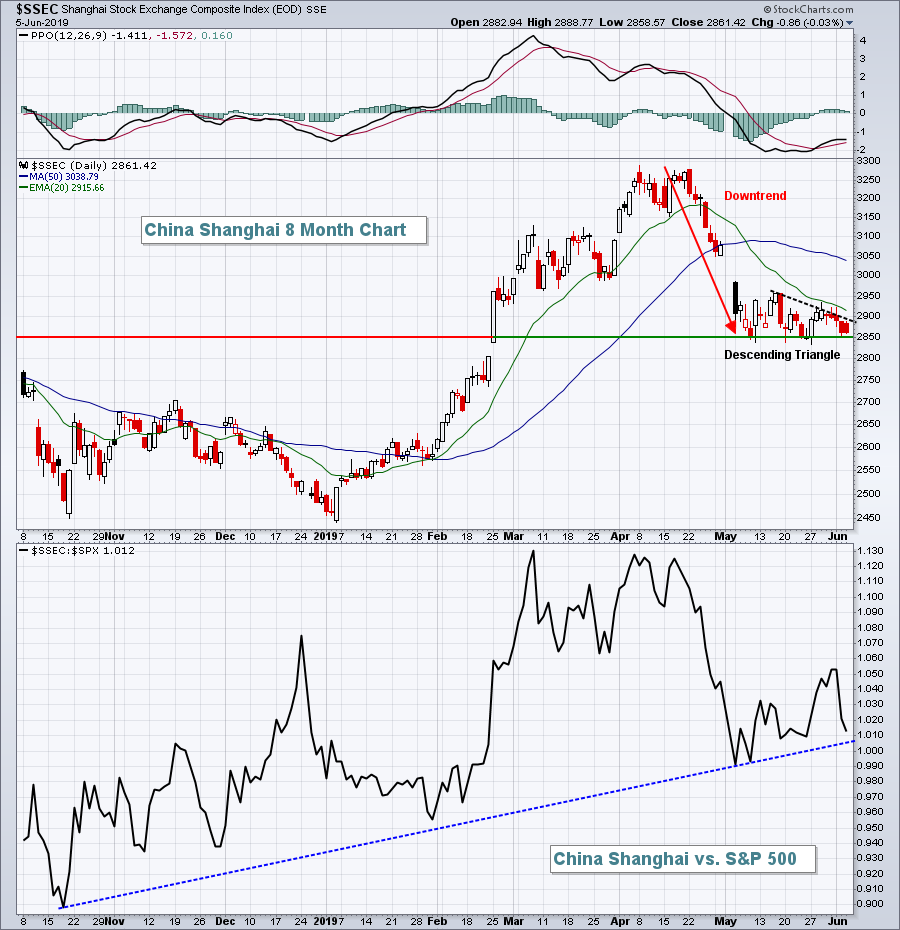 This chart does not include last night's action where the SSEC fell over 1% to close at 2827.
Dow Jones futures are higher this morning by 21 points as the stock market is now beginning to anticipate a rate cut, possibly in July.
Current Outlook
I believe a short-term key for U.S. equities will be the direction of the 10 year treasury yield ($TNX). We nearly tested the 2017 low on the TNX below 2.10%. If that level holds and we begin to move higher on the TNX, that would signal rotation away from the defensive treasury market. That normally coincides with a stock market advance. It wasn't much, but the S&P 500 did manage to close above its 20 day EMA on Wednesday and this morning's futures point to further gains:
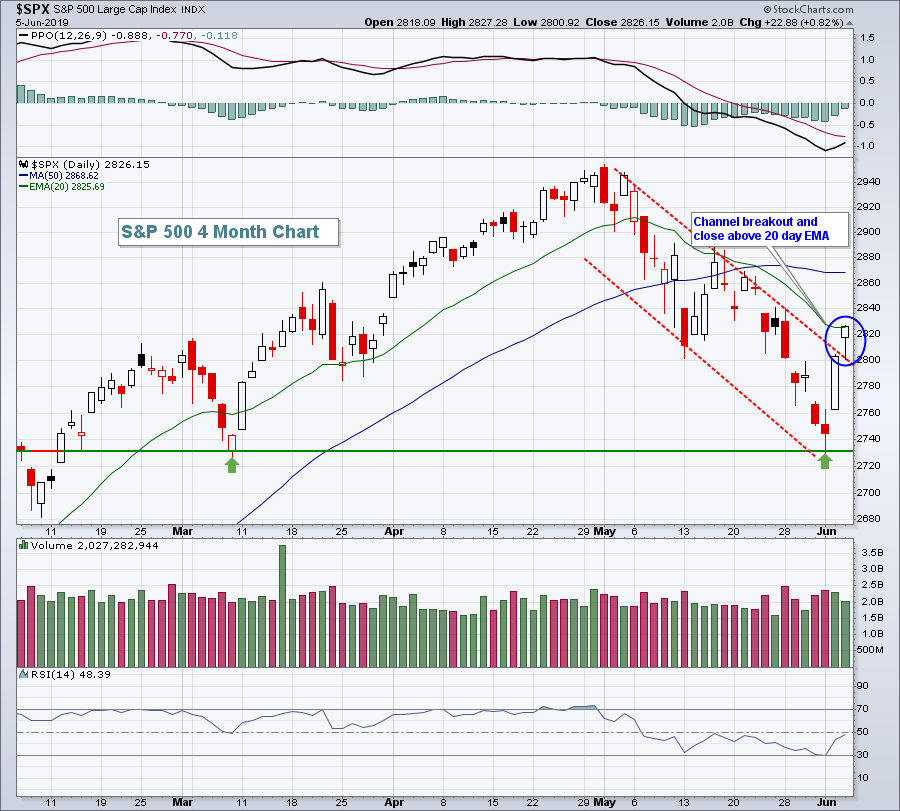 Follow-through buying to more definitively clear the declining 20 day EMA would be a bullish development as the longer-term weekly charts are very bullish in my view.
Sector/Industry Watch
In order to keep it real, it is definitely worth mentioning that Wednesday's rally was suspicious. Speculation and aggressiveness are critical components of a bull market. We want investors/traders to have an appetite for risk. That shows up in a number of ways, but perhaps the most visual is by simply comparing sector performance. One day doesn't make a trend, but the sector leaderboard yesterday was not a confirming signal of market strength:
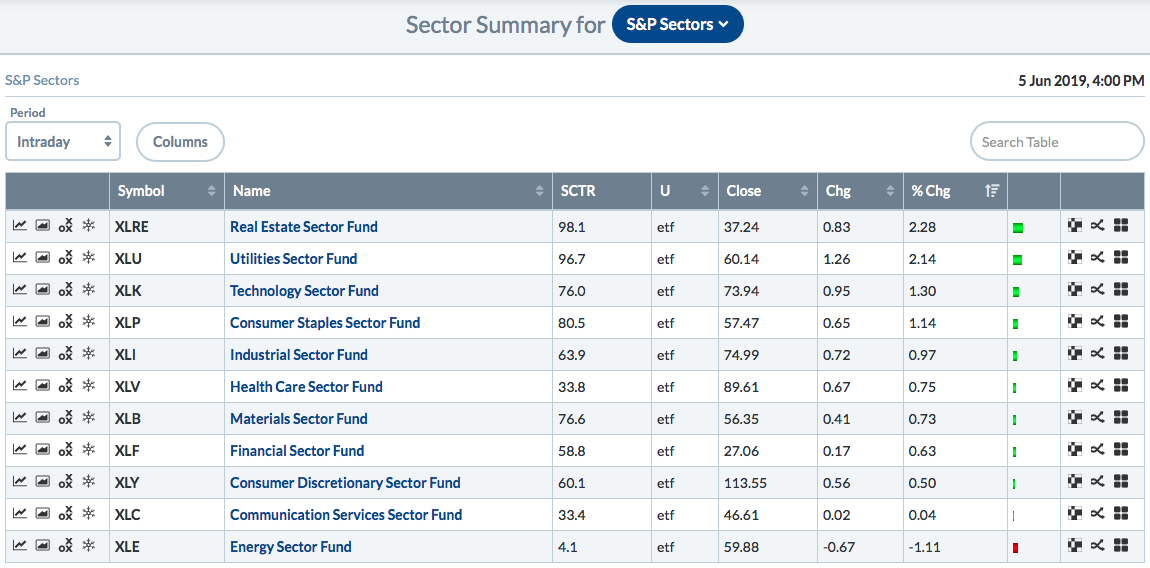 The defensive sectors littered the top half of the sector leaderboard and that's not what I look for when the S&P 500 is attempting to clear a technical hurdle. If the S&P 500 continues to rally back to all-time highs and the structure of sector leadership remains as you see it above, I would run for the hills. I don't believe that will happen, just pointing out what I believe would be a major warning sign.
Historical Tendencies
The NASDAQ has two bearish historical periods during the month of June. Since 1971, here are the annualized return for each period:
June 8-12: -26.61%
June 18-26: -24.34%
Key Earnings Reports
(actual vs. estimate):
CIEN: .48 vs .40
SAIC: 1.36 vs 1.21
SJM: 2.08 vs 1.97
(reports after close, estimate provided):
BYND: (.14)
DOCU: .04
MTN: 7.03
OLLI: .44
ZM: .00
Key Economic Reports
Initial jobless claims released at 8:30am EST: 218,000 (actual) vs 215,000 (estimate)
Q1 productivity released at 8:30am EST: 3.4% (actual) vs. 3.4% (estimate)
Q1 labor unit costs released at 8:30am EST: -1.6% (actual) vs. -0.8% (estimate)
Happy trading!
Tom


