Market Recap for Thursday, July 11, 2019
Dow Jones ($INDU, +0.85%) 27000 is in the record books as another milestone has been reached on Wall Street. The S&P 500 ($SPX, +0.23%) also set another record high close, but fell just short of closing above the psychological 3000 level. The SPX finished at 2999.91. The NASDAQ ($COMPQ, -0.08%) had a bit of a roller coaster ride, from positive to negative and then rallying in the final two hours to nearly complete the all-time high trifecta. The Russell 2000 ($RUT, -0.46%) did what it's been doing for the past year.....badly lagging:
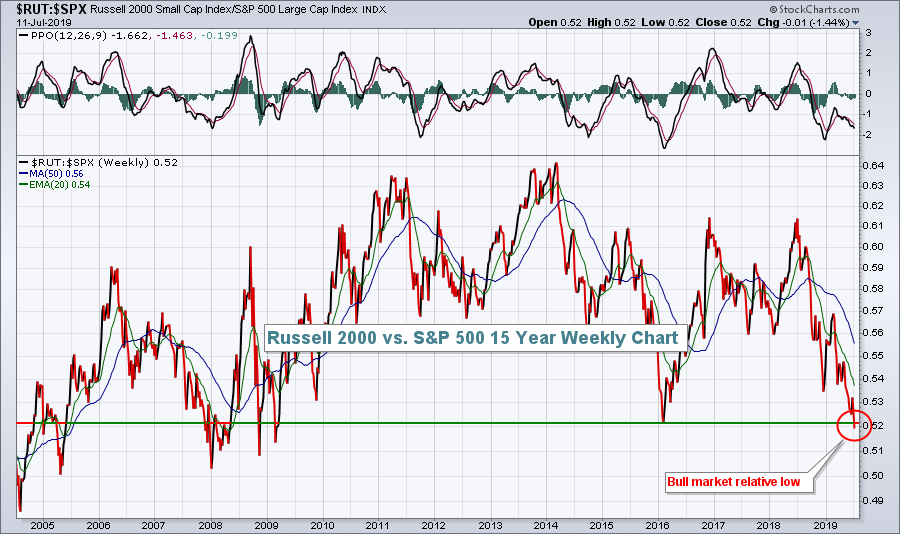 Small caps are setting all the wrong records and there appears to be no end in sight to their relative weakness. For me, it continues to be a head scratcher. But bottom line, it's important to believe what you see and right now I can see that we need to avoid small caps until that relative downtrend reverses.
The U.S. equity market got a lift in two key areas on Thursday. First, crude oil prices ($WTIC, -0.38%), while slightly lower, managed to close above $60 per barrel for the second consecutive day. That enabled energy shares (XLE, +0.20%) to close above 64.00 for a second straight day. We haven't seen that in 10 weeks. Second, and perhaps more importantly, Unitedhealth Group (UNH, +5.47%) soared after the White House abandoned its plan to eliminate rebates from government drug plans. Not only did UNH provide a huge boost to the Dow Jones as its top performer, but the S&P 500 was littered with leaders from the health care providers group ($DJUSHP, +4.82%). CIGNA Corp (CI) and Anthem, Inc. (ANTM) joined UNH atop this list. For more on the DJUSHP, scroll down to the Sector/Industry Watch section.
Pre-Market Action
Dow Jones futures are poised to extend Thursday's advance as they're higher by 87 points as we move closer to today's opening bell. Asian markets were higher last night and Europe is looking at higher prices this morning, both likely buoyed by the records set in the U.S. on Thursday.
The 10 year treasury yield ($TNX) is jumping again this morning, up 2 more basis points to 2.14%. That helps to fuel an equity rally as money rotates from treasuries to equities.
One ongoing problem that's likely to be intensifed today is the biotech group ($DJUSBT). The group broke to a new 52-week relative low (vs. the S&P 500) yesterday and Illumina (ILMN), one of the group's best performing stocks warned regarding its upcoming quarterly revenues and EPS. ILMN is down nearly 15% in pre-market trading at last check.
Current Outlook
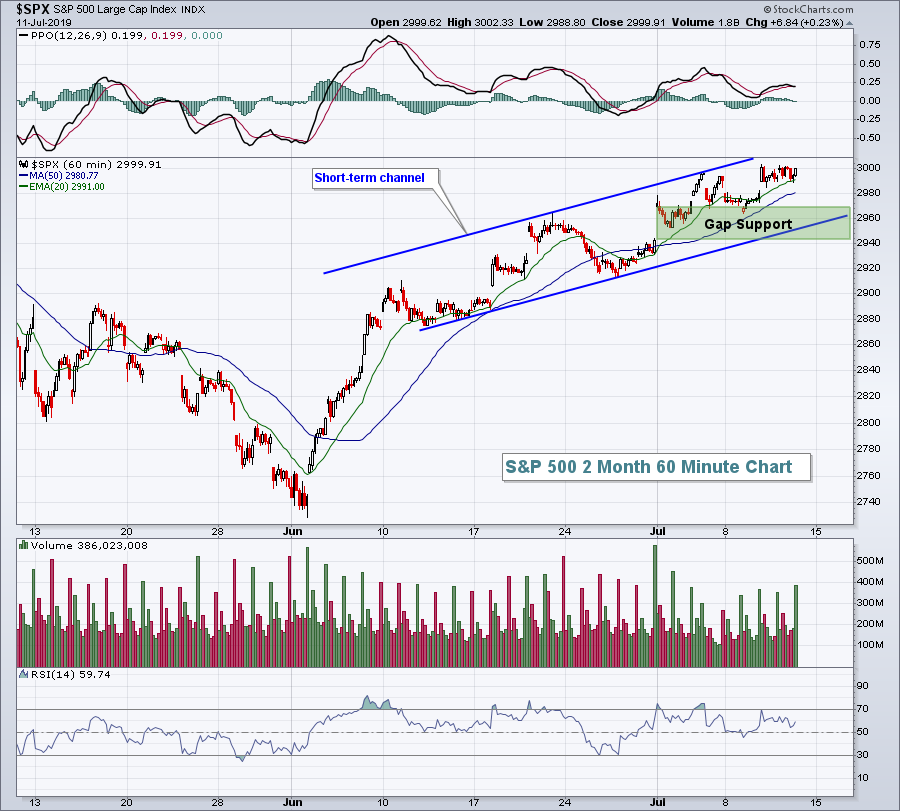
Given the recent breakout to all-time highs, it's difficult to argue that U.S. equities are trending higher. Therefore, I'd turn my attention to the short-term hourly chart to look for areas of key trendline, price and gap support. Here's that chart for the S&P 500:
 I remain very bullish and expect we're going to head higher as we enter another quarterly earnings season. I recently joined EarningsBeats.com for a "2019 2nd Half Market Outlook" webinar. If you'd like to see that webinar free of charge, simply CLICK HERE to join EarningsBeats.com's free 3x a week newsletter that focuses on earnings and relative strength. Once you enter your name and email address, you'll land on a page where you can simply click on a link for the recording. Enjoy!
Sector/Industry Watch
While healthcare (XLV, +0.02%) barely budged higher yesterday, that was not the case for a key industry group within healthcare. The Dow Jones U.S. Health Care Providers Index ($DJUSHP, +4.82%) surged on the White House news mentioned above and appears to me to be a character change on the DJUSHP chart:
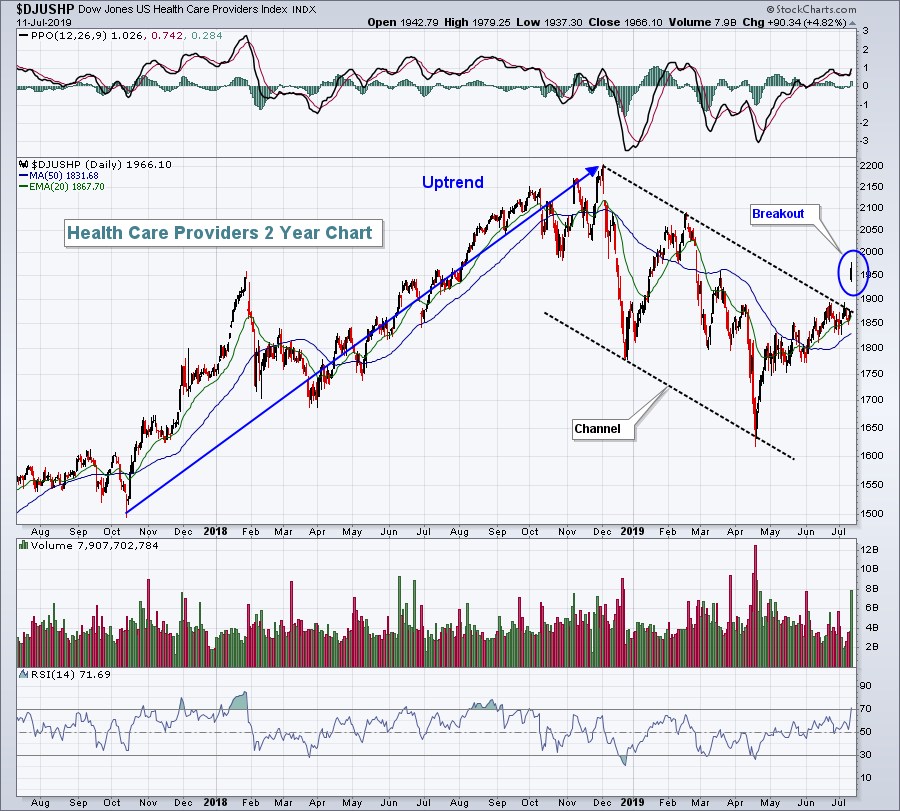 If you recall, the DJUSHP was a relative leader throughout 2018....until the huge December selloff started a down channel. Yesterday's surge appears to have broken that downtrend. We could see the DJUSHP once again become a relative leader.
Historical Tendencies
The Russell 2000 ($RUT) has been underperforming the S&P 500 for quite some time and there's no indication it's about to change on the charts. Historically (last 20 years), here's how the Russell 2000 performs relative to the S&P 500 by calendar month:
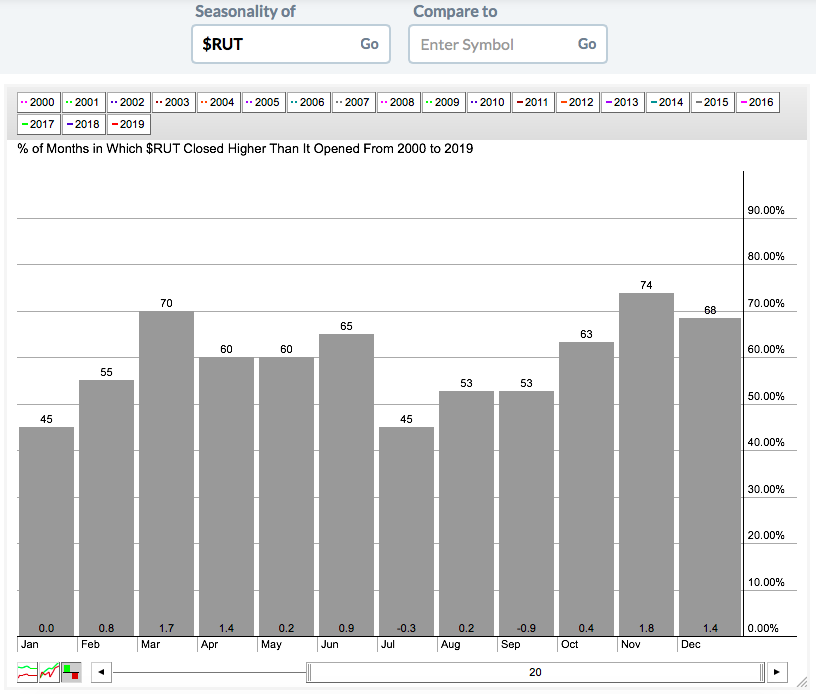 The historical relative strength that the RUT typically enjoys in the first half of the year never materialized in 2019. Small cap bulls hope the RUT:SPX relative trend continues to run opposite historical norms as the next three months show a history of relative underperformance for small caps - not good news.
Key Earnings Reports
(actual vs. estimate):
INFY: .14 vs .13
Key Economic Reports
June PPI released at 8:30am EST: +0.1% (actual) vs. +0.1% (estimate)
June Core PPI released at 8:30am EST: +0.3% (actual) vs. +0.2% (estimate)
Happy trading!
Tom


