Market Recap for Friday, July 19, 2019
Wall Street finished on a very weak note on Friday as hopes for a 50 basis point reduction in the fed funds rate decreased. There is now a much stronger likelihood of a 25 basis point drop when the Fed meets for two days next week. News that Iran seized a British oil tanker also concerned traders, although it did help crude oil prices ($WTIC, +0.61%) jump after a very difficult week in which oil had fallen more than 8% prior to the slight push higher on Friday. The energy ETF (XLE, +0.46%) trailed only industrials (XLI, +0.55%) as the leading sector on Friday and the reversal occurred at a very timely point:
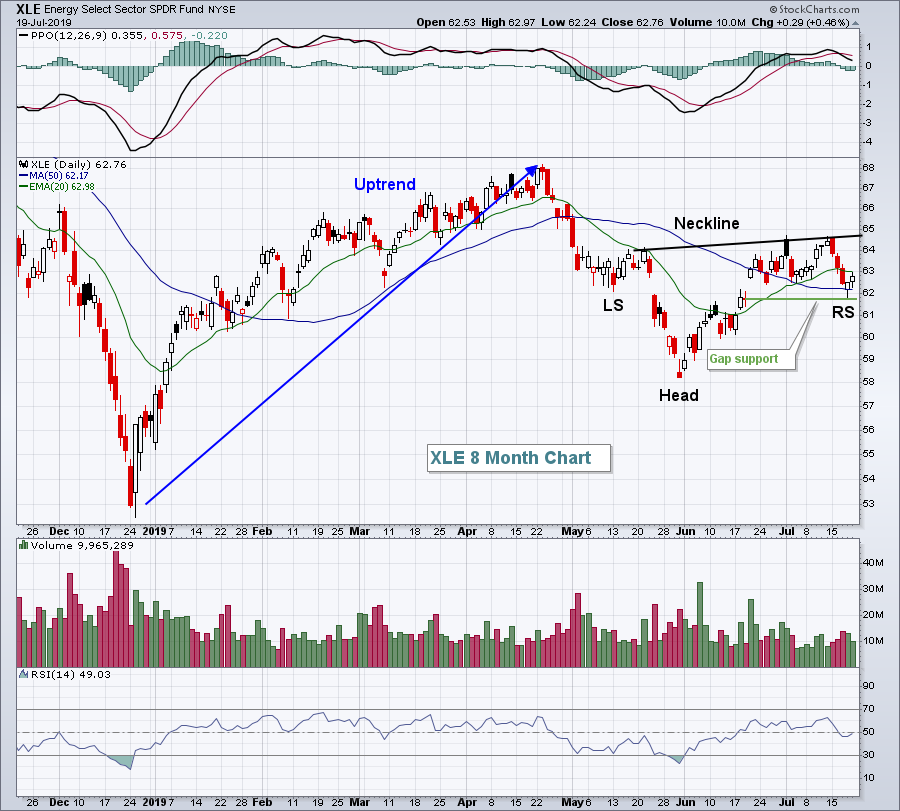 That's a sloppy, but bullish, inverse head & shoulders continuation pattern that suggests the XLE will head higher. I'm not a fan of the XLE on a relative basis as I still believe the U.S. Dollar Index ($USD) is heading higher, but I always want to see wide participation during a market rally. I'd look for the XLE to head higher, but I just don't see the group outperforming the S&P 500.
The 10 year treasury yield ($TNX) has fallen back beneath its 20 day EMA and that has hurt financials (XLF, -0.43%) as the group neared a key breakout level. Real estate (XLRE), however, was the worst performer on Friday, dropping 1.63% and nearing a very key short-term price and trendline support level. The XLRE is highlighted in the Sector/Industry Watch section below.
Pre-Market Action
Well, earnings season is about to pick up. We saw some pretty solid earnings reports out of many "blue-chip" type companies, including some of the largest banks. This week, we'll turn our attention to companies like Facebook (FB) and Amazon.com (AMZN). I expect very positive results from both, especially FB.
Micron Technology (MU) is continuing its recent blazing push higher as it was upgraded by Goldman Sachs from "neutral" to "buy". Crude oil ($WTIC) is up over 1% as it benefits from lingering geopolitical concerns.
Asian markets were mostly lower overnight, but European markets are higher. Here in the U.S., Dow Jones futures are solid and up 62 points as we appear ready to begin a new trading week on an up note.
Current Outlook
The NASDAQ's 60 minute chart still remains fairly bullish. Last week's weak finish reset the hourly PPO and the price action remains in a solid up channel:
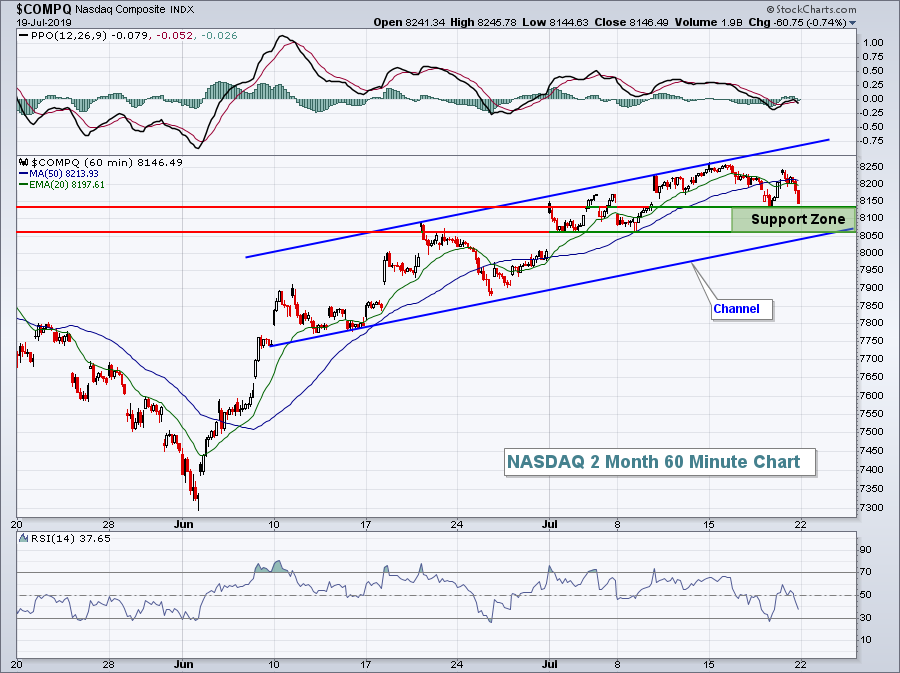 A trip below 8050 would begin to suggest deterioration on the intraday hourly chart and would require a re-evaluation of the daily chart. Until then, however, I'll remain bullish and expect higher prices.
Sector/Industry Watch
Real estate (XLRE) has a very rough session on Friday and is now nearing a critical short-term area as you can see below:
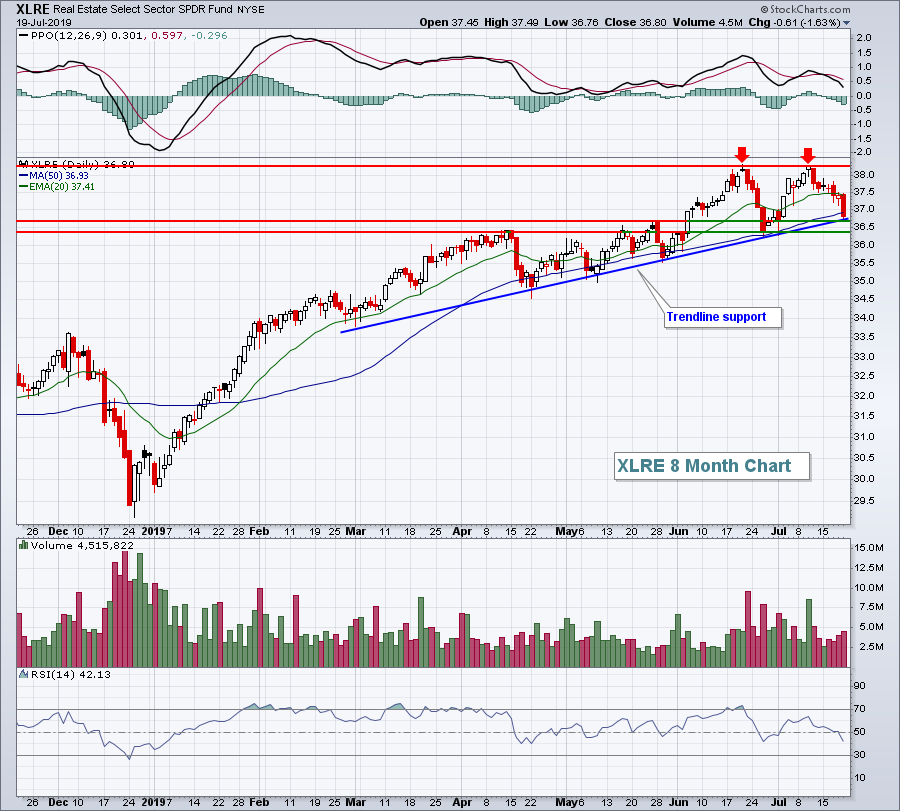 36.40-36.60 appears to be an area where the ETF should find buyers.
Monday Setups
There are some seriously good things happening with Applied Materials (AMAT). I don't have the news, but I have the chart. Volume has been pouring in and the stock is one of the best relative performers in the semiconductor space ($DJUSSC). Check out the absolute and relative strength:
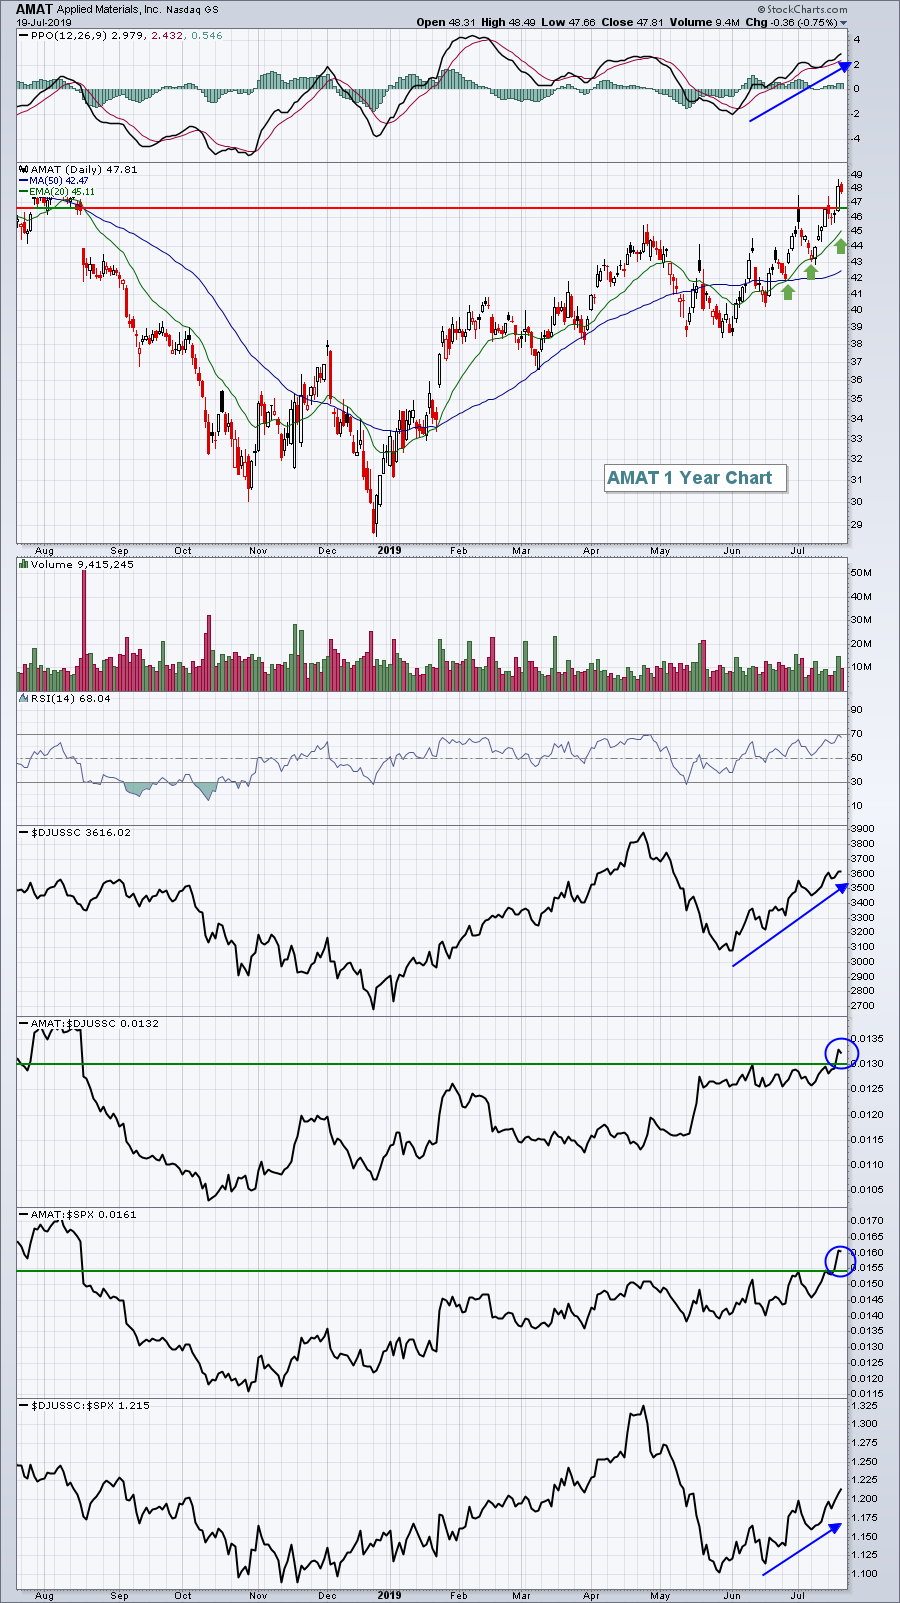 The DJUSSC is gaining strength on both an absolute and relative basis and AMAT is one of the best-looking stocks in the group. The green arrows mark successful 20 day EMA tests. During an uptrend, reversals at the 20 day EMA are quite bullish. I think AMAT is heading back to test the low-60s where it topped in early 2018.
AMAT doesn't report its earnings until August, but I expect them to be very strong with guidance likely raised. Tonight, a different technology company reports quarterly results and I believe they'll be blowout. I highlighted it in EarningsBeats.com's FREE EB Digest article this morning. If you sign up today, they'll send you a copy of today's article. CLICK HERE to subscribe.
Historical Tendencies
Looking ahead, August and September have been the worst two calendar months of the year for the S&P 500. Since 1950, these two months have produced annualized returns of -0.50% and -5.51%, respectively. They're the only two calendar months that have produced negative annualized returns.
Key Earnings Reports
(actual vs. estimate):
HAL: .35 vs .30
LII: 3.74 vs 4.15
RPM: 1.24 vs 1.14
(reports after close, estimate provided):
ACC: .54
AMTD: .97
BRO: .28
CDNS: .53
CE: 2.36
CR: 1.55
ELS: .94
HXL: .88
LOGI: .35
STLD: .87
WHR: 3.80
ZION: 1.09
Key Economic Reports
None
Happy trading!
Tom


